Fig. B.1
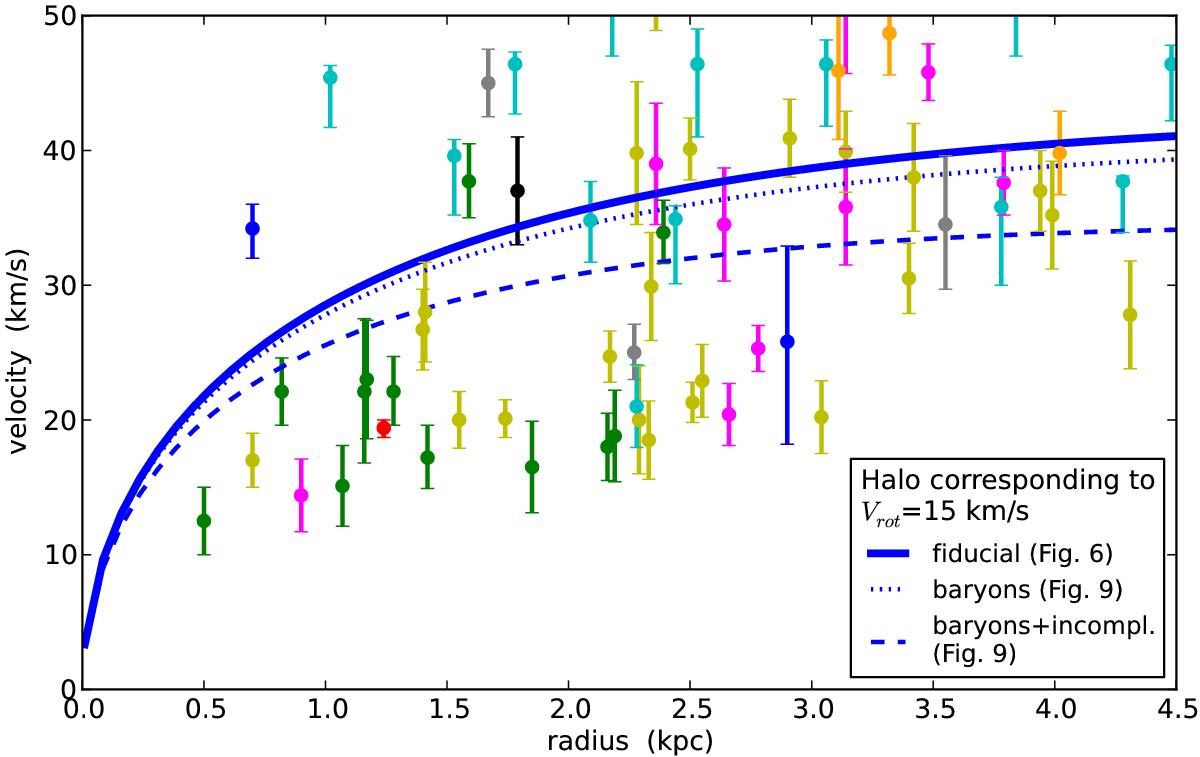
Last measured point radii and velocities for dwarf galaxies. The datapoints represent the radii and velocities at the LMP for some of the galaxies with resolved HI observations (Sect. 3.1). This plot is restricted to VLMP< 50 km s-1, where most of the “failing” extreme dwarf galaxies in Fig. 6 are found. The datapoints are color coded according to their original data reference, same as in Fig. 6. The three blue lines represent the RCs of NFW halos that are assigned through AM to galaxies with Vrot = 15 km s-1. In particular, the solid line represents the fiducial AM result (Fig. 6), the dotted line represents the AM result including baryonic effects on the abundance of halos, and the dashed line represents the AM result including baryonic effects on the abundance of halos and observational incompleteness of the ALFALFA VF (see Fig. 9).
Current usage metrics show cumulative count of Article Views (full-text article views including HTML views, PDF and ePub downloads, according to the available data) and Abstracts Views on Vision4Press platform.
Data correspond to usage on the plateform after 2015. The current usage metrics is available 48-96 hours after online publication and is updated daily on week days.
Initial download of the metrics may take a while.