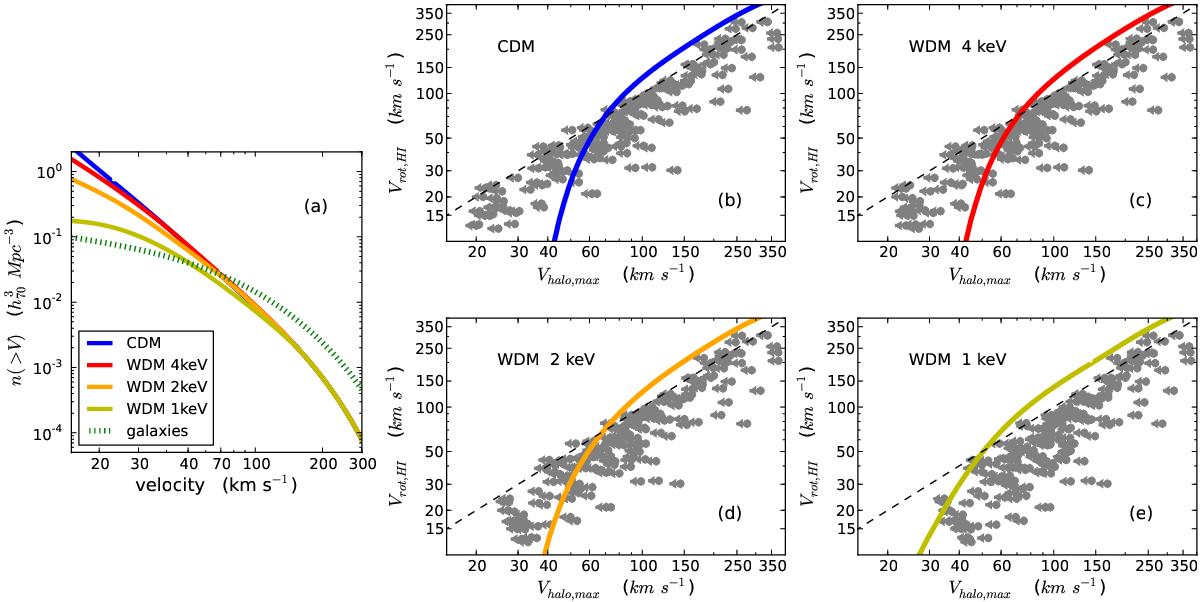
Fig. 11

Vrot − Vh diagrams in WDM cosmologies. Panel a) the blue solid line corresponds to the cumulative halo velocity function in a CDM model (same as black solid line in Fig. 3). The red, orange and yellow solid lines correspond to WDM models with particle masses of 4 keV, 2 keV and 1 keV, respectively (Schneider et al. 2014). The dotted green line is the cumulative VF for galaxies of all morphological types (same as solid green line in Fig. 3). Panels b)–e) the colored solid lines correspond to the Vrot − Vh relations in each dark matter model (same color coding as in panel a), inferred by AM. The gray datapoints represent our sample of literature galaxies with HI rotation curves. The same galaxy can be assigned a different value of Vh in each of the four panels, because each model has a different median mass-concentration relation (Schneider et al. 2012).
Current usage metrics show cumulative count of Article Views (full-text article views including HTML views, PDF and ePub downloads, according to the available data) and Abstracts Views on Vision4Press platform.
Data correspond to usage on the plateform after 2015. The current usage metrics is available 48-96 hours after online publication and is updated daily on week days.
Initial download of the metrics may take a while.


