Fig. 10
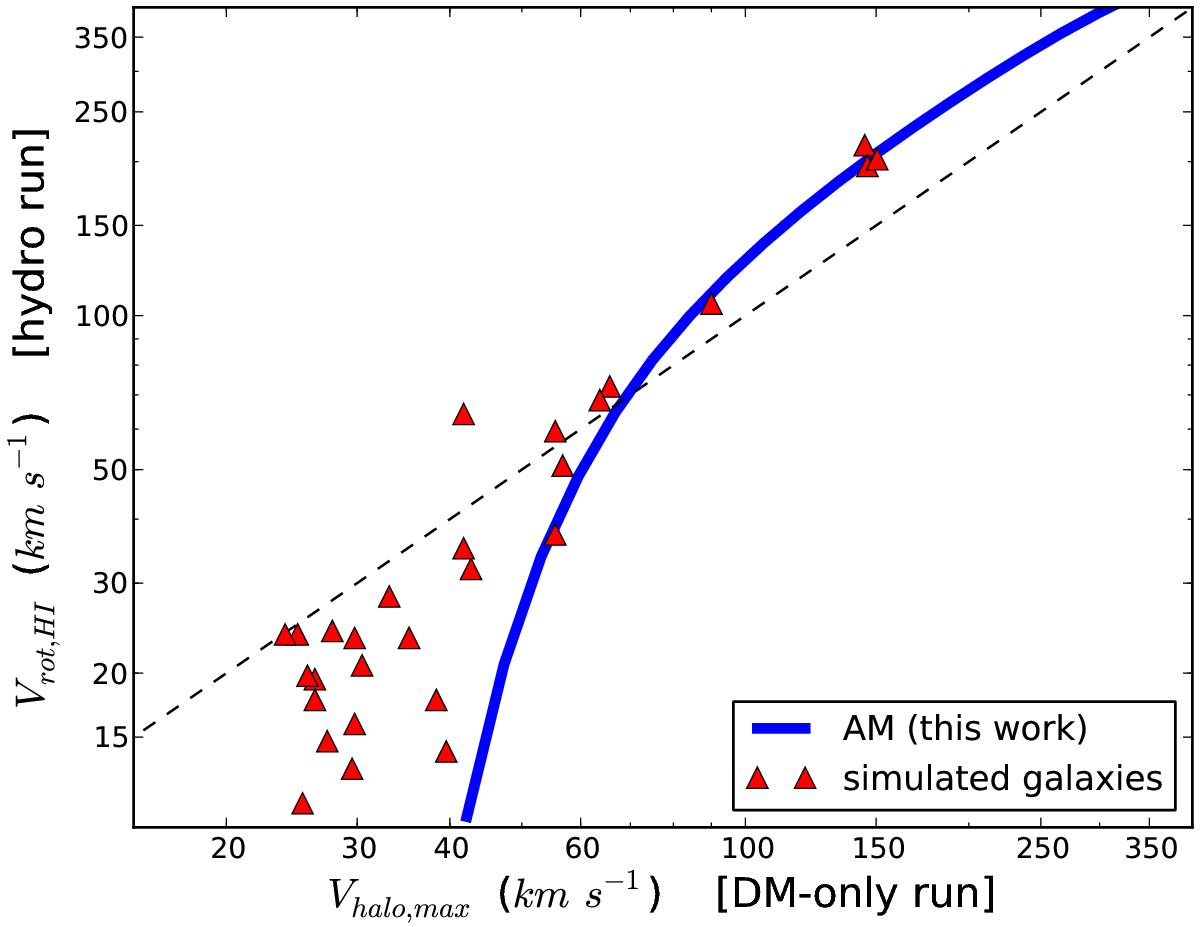
Baryonic effects on galactic rotation curves. The blue solid line is the average Vrot − Vh relation in a ΛCDM universe (same as in Fig. 4). The red triangles represent galaxies from a set of hydrodynamic simulations which include efficient baryonic feedback (Governato et al. 2012; Brooks & Zolotov 2014; Christensen et al. 2014). Simulated low-velocity galaxies fall in the same region of the Vrot − Vh diagram as the actual dwarfs plotted in Fig. 6. This demonstrates that baryonic modifications of the galaxies’ rotation curves do not significantly affect the simplified analysis performed in this work.
Current usage metrics show cumulative count of Article Views (full-text article views including HTML views, PDF and ePub downloads, according to the available data) and Abstracts Views on Vision4Press platform.
Data correspond to usage on the plateform after 2015. The current usage metrics is available 48-96 hours after online publication and is updated daily on week days.
Initial download of the metrics may take a while.