Fig. 1
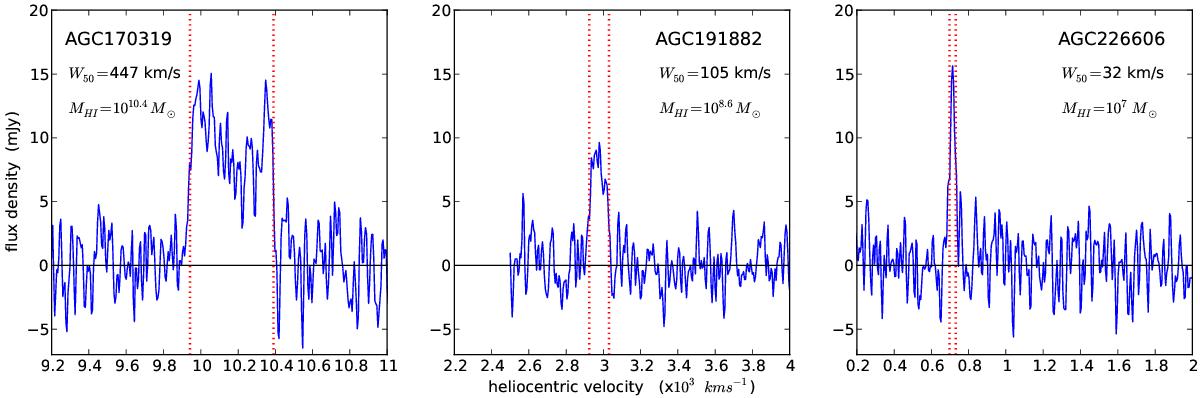
HI-line profiles for three representative ALFALFA sources. For each galaxy the velocity width, W50, is measured between the two outermost points where the flux density falls to 50% of the peak value (red vertical lines). Left panel: MW analog with a typical “double horned” profile, indicative of a mostly flat outer rotation curve. Central panel: dwarf galaxy with a “boxy” profile shape. Right panel: extreme dwarf galaxy with a clearly “single-peaked” profile, suggestive of a rising rotation curve. Keep in mind that narrow profiles can also correspond to intrinsically high-width objects that are oriented close to face-on. Note also that the velocity span of the x-axis in all three panels is the same (1800 km s-1), and so profile widths are plotted to scale.
Current usage metrics show cumulative count of Article Views (full-text article views including HTML views, PDF and ePub downloads, according to the available data) and Abstracts Views on Vision4Press platform.
Data correspond to usage on the plateform after 2015. The current usage metrics is available 48-96 hours after online publication and is updated daily on week days.
Initial download of the metrics may take a while.