Fig. 8
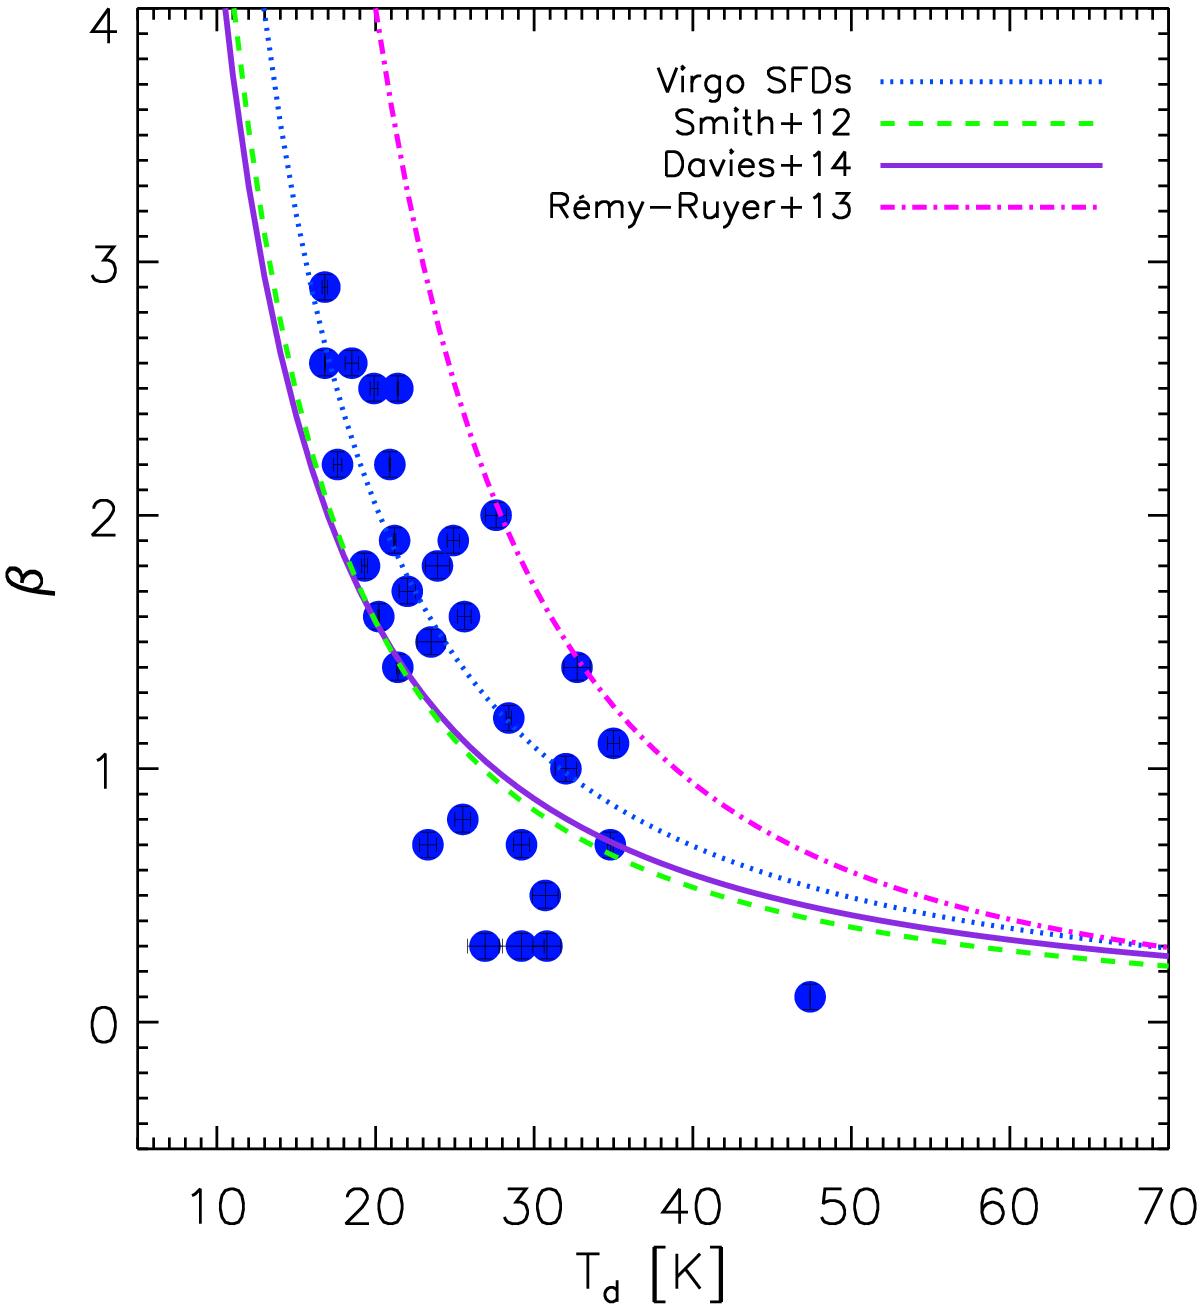
Emissivity index plotted against dust temperature for the Virgo SFDs (filled blue dots). The dotted line shows the best-fit power law to our data set. For comparison we overlay the β − Td relation found in Andromeda (Smith et al. 2012), Virgo galaxies later than S0 (Davies et al. 2014), and DGS galaxies (Rémy-Ruyer et al. 2013).
Current usage metrics show cumulative count of Article Views (full-text article views including HTML views, PDF and ePub downloads, according to the available data) and Abstracts Views on Vision4Press platform.
Data correspond to usage on the plateform after 2015. The current usage metrics is available 48-96 hours after online publication and is updated daily on week days.
Initial download of the metrics may take a while.