Fig. 7
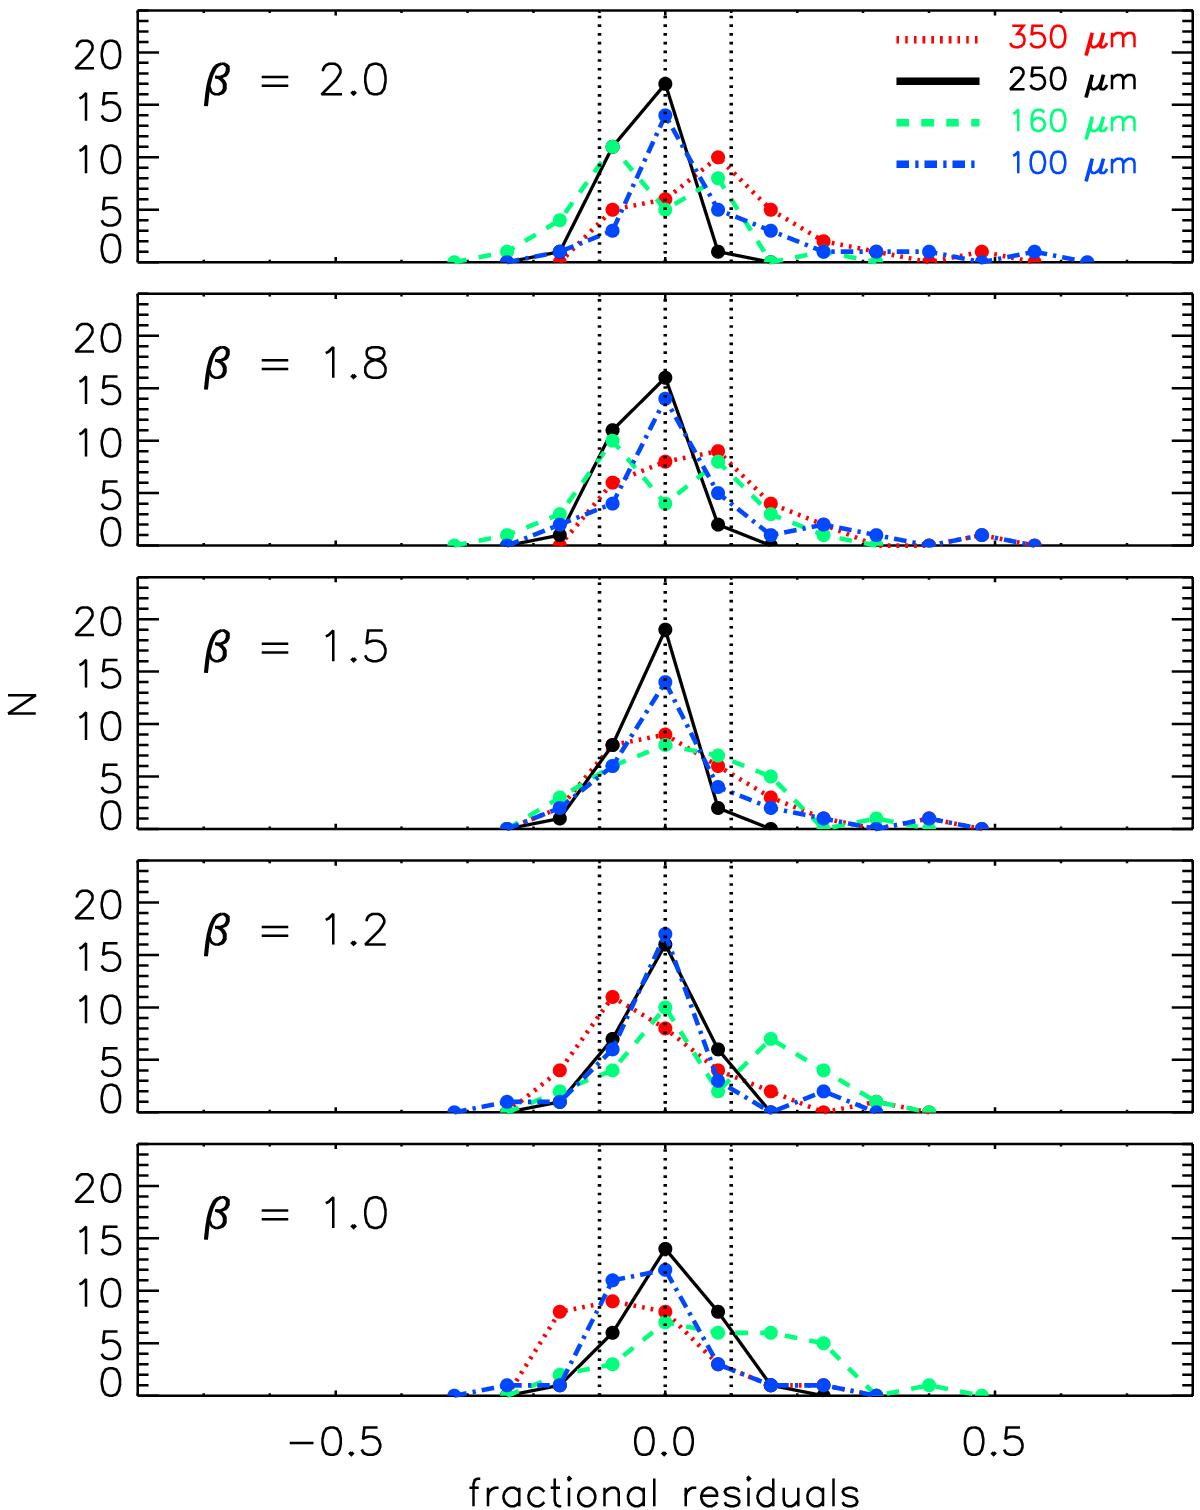
Fractional residuals of the SED fitting at different wavelengths for β = 1.0,1.2,1.5,1.8,2.0. The fractional residual is calculated as the difference at each wavelength between the measured flux density and best-fit model divided by the best-fit model. The vertical dotted lines correspond to fractional residuals of 0 and ±0.1. The colours correspond to the four wavelengths considered for the SED fitting: 350 μm (red), 250 μm (black), 160 μm (green), 100 μm (blue).
Current usage metrics show cumulative count of Article Views (full-text article views including HTML views, PDF and ePub downloads, according to the available data) and Abstracts Views on Vision4Press platform.
Data correspond to usage on the plateform after 2015. The current usage metrics is available 48-96 hours after online publication and is updated daily on week days.
Initial download of the metrics may take a while.