Fig. 6
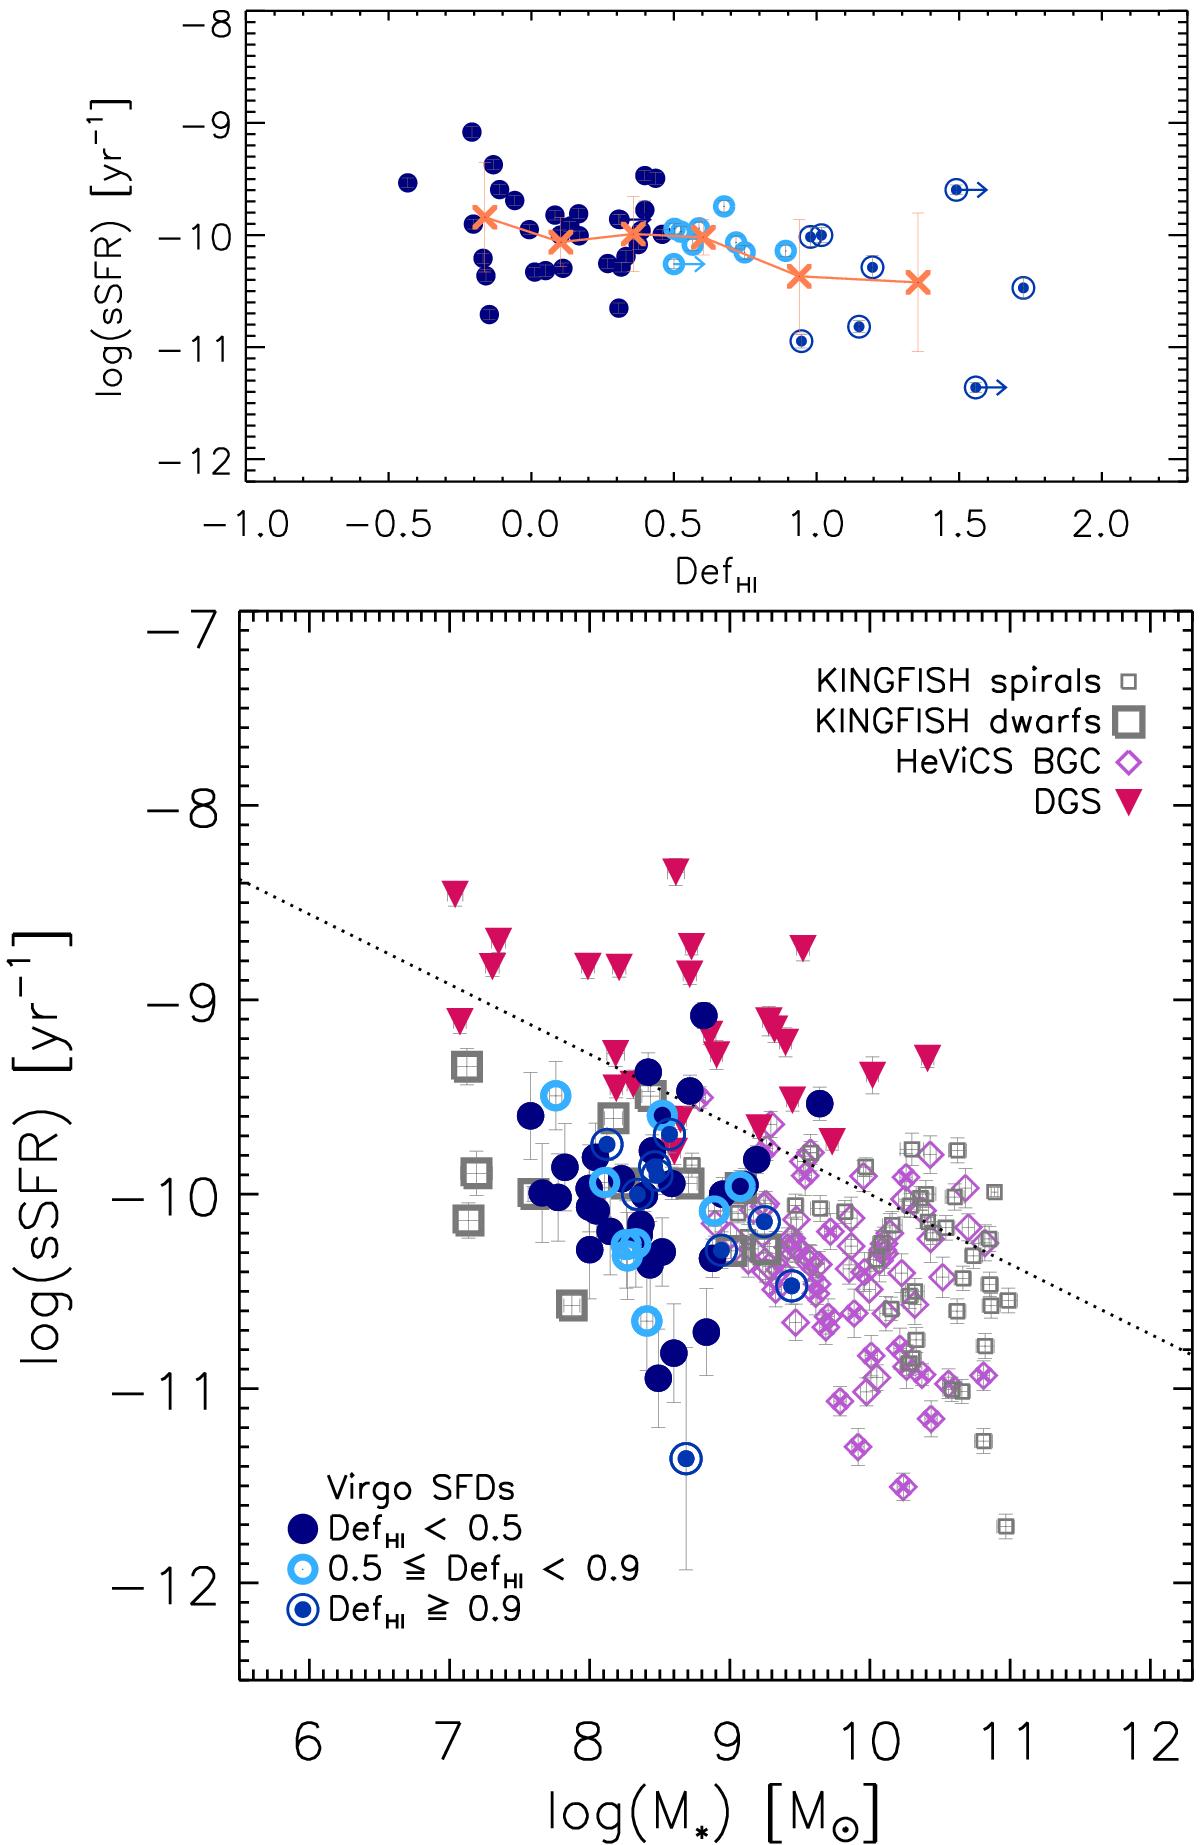
Upper panel: specific star formation rate against Hi deficiency for Virgo SFDs. Crosses denote the average value in each bin of DefHI. Lower panel: specific star formation rates versus stellar masses. Blue symbols correspond to the Virgo SFDs, with the different shapes indicating the atomic hydrogen content of the galaxies as given by the Hi deficiency parameter. Symbols of comparison samples are the same used in Fig. 5. The dotted line indicates the star formation sequence defined by Schiminovich et al. (2007).
Current usage metrics show cumulative count of Article Views (full-text article views including HTML views, PDF and ePub downloads, according to the available data) and Abstracts Views on Vision4Press platform.
Data correspond to usage on the plateform after 2015. The current usage metrics is available 48-96 hours after online publication and is updated daily on week days.
Initial download of the metrics may take a while.