Fig. A.1
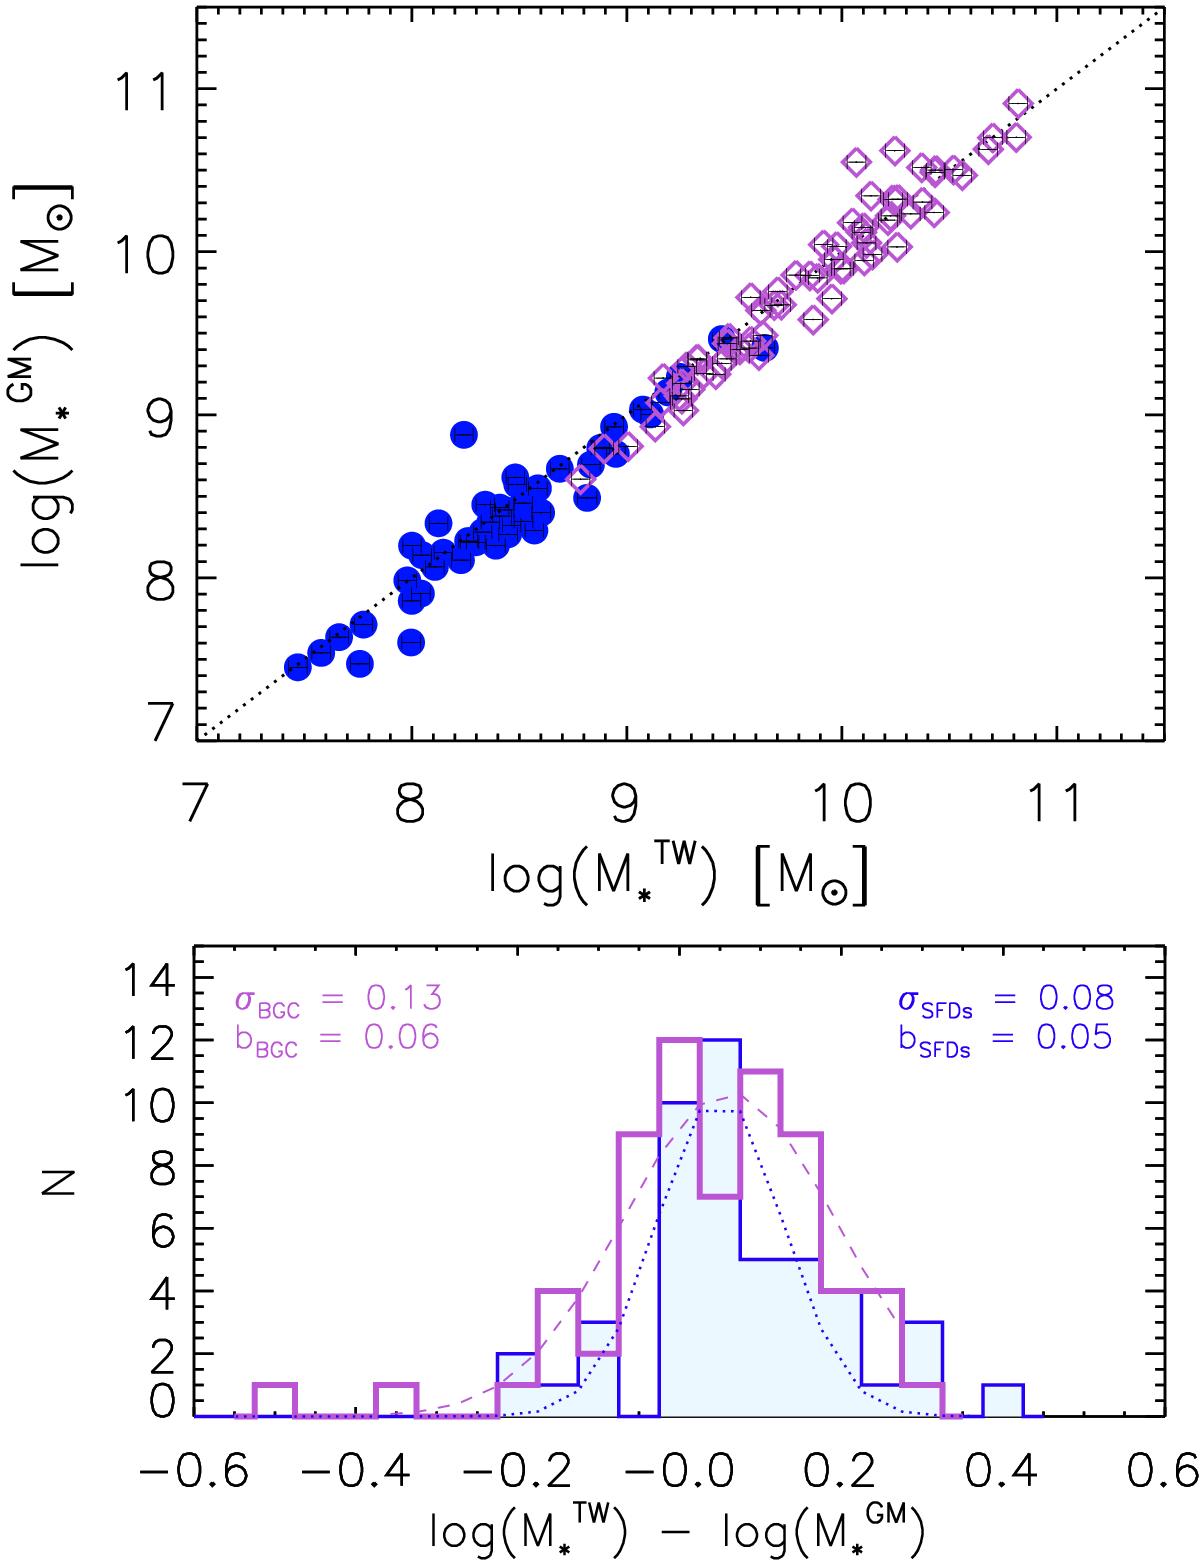
Upper panel: comparison between stellar masses
estimated in this work from WISE photometry,
![]() , and those derived from the
i
magnitude and (g −
i)0 colour following Gavazzi et al. (2013a), extracted from the GOLDMine database
, and those derived from the
i
magnitude and (g −
i)0 colour following Gavazzi et al. (2013a), extracted from the GOLDMine database
![]() . Blue dots and purple diamonds
correspond to the HeViCS SFDs and BGC galaxies, respectively. The dotted line
shows the one-to-one relation. Lower panel: distribution of the
residuals of the two stellar mass estimates for the HeViCS dwarfs (blue histogram)
and BGC galaxies (purple histogram). The resulting gaussian fit is overlaid to
both histograms.
. Blue dots and purple diamonds
correspond to the HeViCS SFDs and BGC galaxies, respectively. The dotted line
shows the one-to-one relation. Lower panel: distribution of the
residuals of the two stellar mass estimates for the HeViCS dwarfs (blue histogram)
and BGC galaxies (purple histogram). The resulting gaussian fit is overlaid to
both histograms.
Current usage metrics show cumulative count of Article Views (full-text article views including HTML views, PDF and ePub downloads, according to the available data) and Abstracts Views on Vision4Press platform.
Data correspond to usage on the plateform after 2015. The current usage metrics is available 48-96 hours after online publication and is updated daily on week days.
Initial download of the metrics may take a while.