Fig. 15
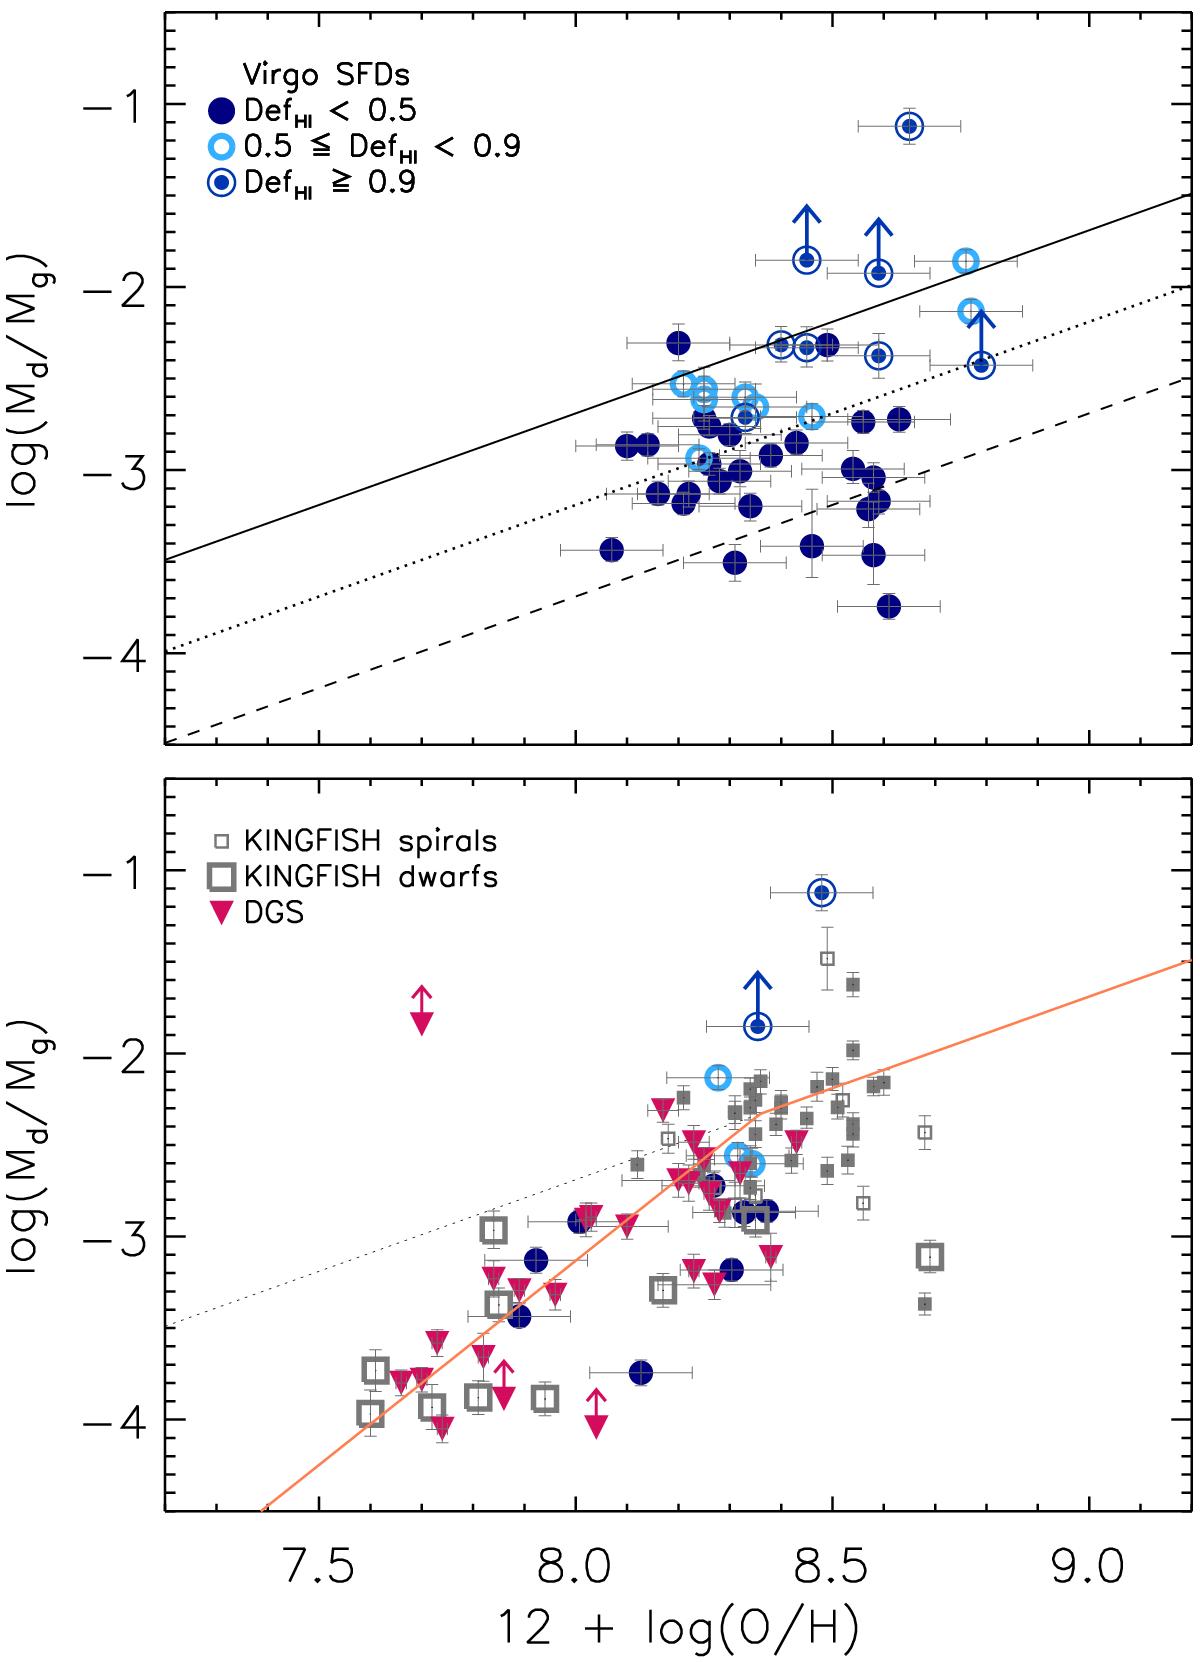
Upper panel: dust-to-gas mass ratios against
metallicity for Virgo SFDs. Here we plot the oxygen abundance obtained from N2 e
O3N2 indices for the whole sample. Solid line indicates a linear scaling of the
Milky Way ![]() and metallicity, dotted and dashed lines correspond to a factor of 5 and 10
difference from MW, respectively. Lower panel: comparison data for
KINGFISH and DGS samples. Here the metallicity of Virgo SFDs was derived using the
R23 ratio only for 13 objects with
[OII]λ3727 line measurements available in the
literature. A broken power-law fit (orange line) with a break at [12 +
log (O/H) ] break =
8.36 and low-metallicity slope α = 2.23, is overlaid
to the data. The dotted line shows the linear scaling of the dust-to-gas ratio of
the Milky Way with metallicity.
and metallicity, dotted and dashed lines correspond to a factor of 5 and 10
difference from MW, respectively. Lower panel: comparison data for
KINGFISH and DGS samples. Here the metallicity of Virgo SFDs was derived using the
R23 ratio only for 13 objects with
[OII]λ3727 line measurements available in the
literature. A broken power-law fit (orange line) with a break at [12 +
log (O/H) ] break =
8.36 and low-metallicity slope α = 2.23, is overlaid
to the data. The dotted line shows the linear scaling of the dust-to-gas ratio of
the Milky Way with metallicity.
Current usage metrics show cumulative count of Article Views (full-text article views including HTML views, PDF and ePub downloads, according to the available data) and Abstracts Views on Vision4Press platform.
Data correspond to usage on the plateform after 2015. The current usage metrics is available 48-96 hours after online publication and is updated daily on week days.
Initial download of the metrics may take a while.