Fig. 13
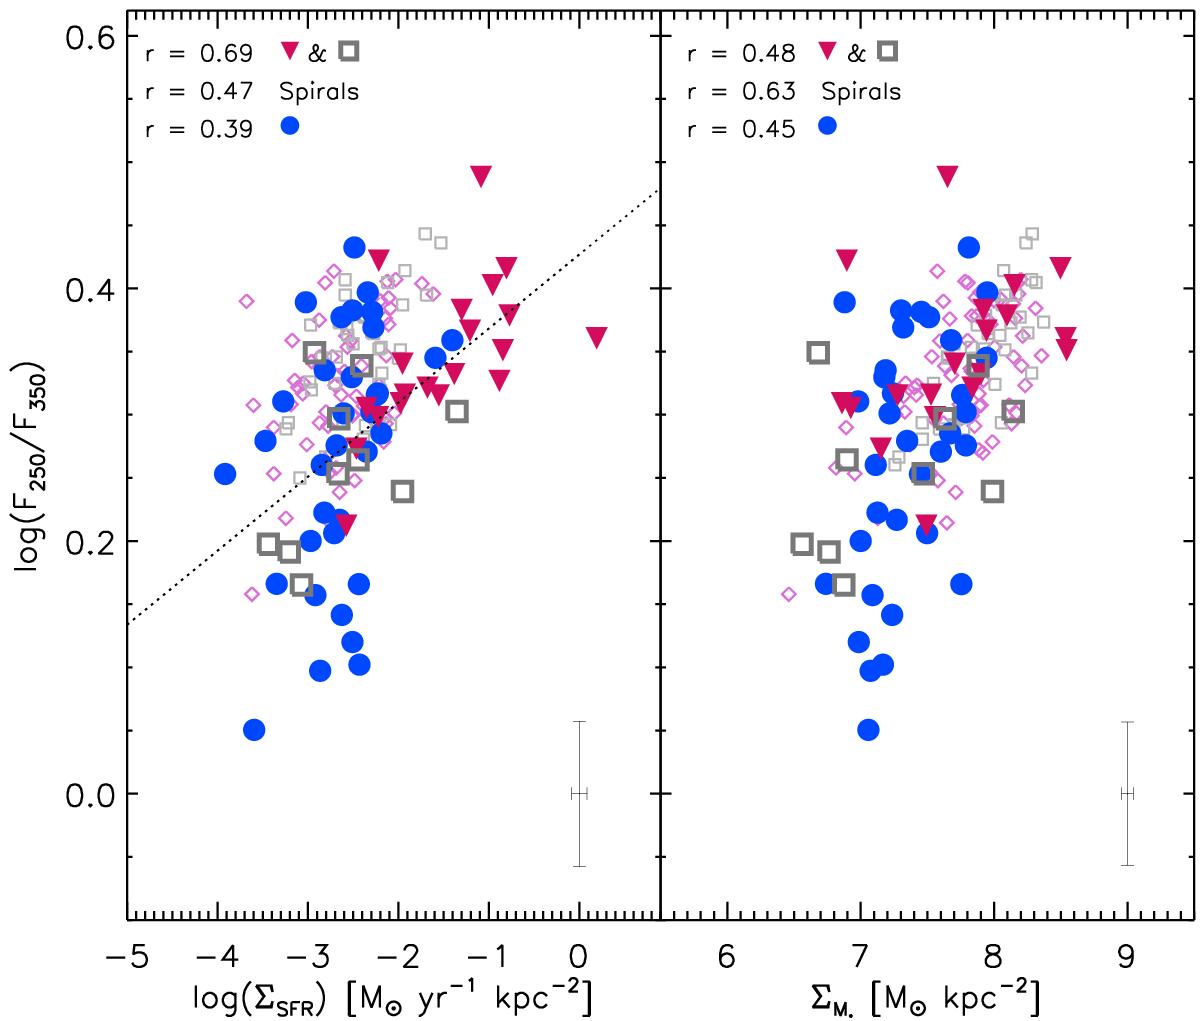
Left panel: SPIRE colour F250/F350 against star formation rate surface density. Symbols are the same used in Fig. 12. The dotted line is a least square fit to the DGS and KINGFISH dwarf galaxies. Right panel: SPIRE colour F250/F350 against stellar mass surface density Pearson correlation coefficients for the different samples are displayed at the top-left corner of each panel. The mean error bars are displayed at the bottom-right corner of each panel.
Current usage metrics show cumulative count of Article Views (full-text article views including HTML views, PDF and ePub downloads, according to the available data) and Abstracts Views on Vision4Press platform.
Data correspond to usage on the plateform after 2015. The current usage metrics is available 48-96 hours after online publication and is updated daily on week days.
Initial download of the metrics may take a while.