Fig. 12
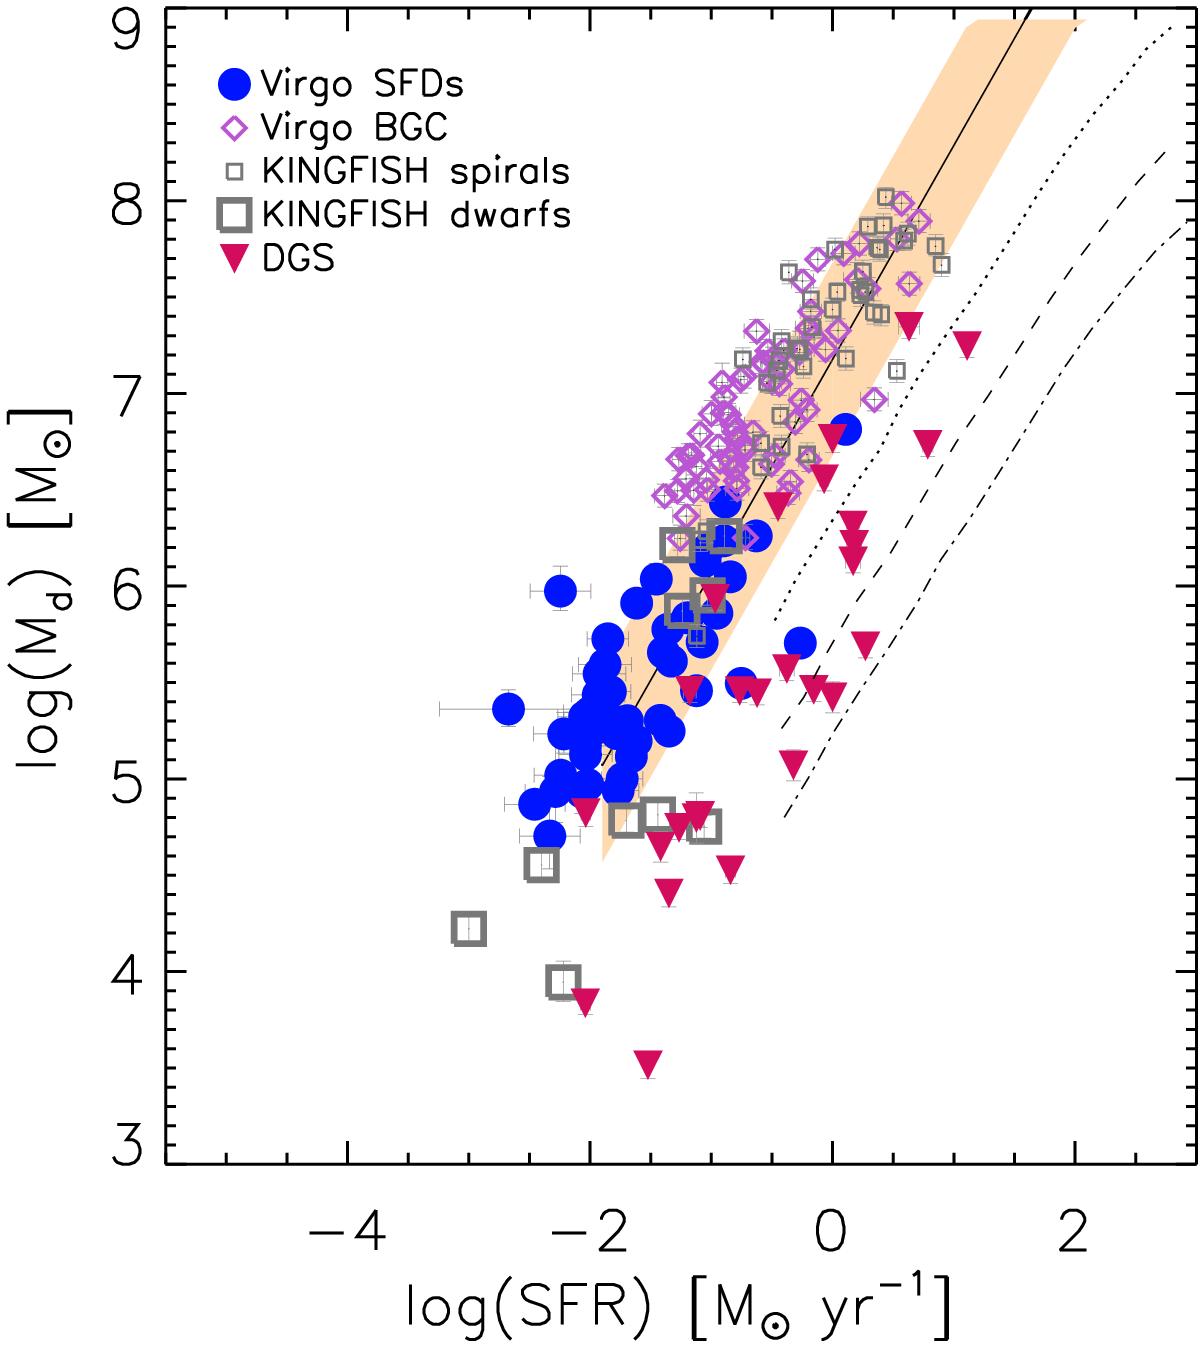
Dust mass versus star formation rate for the Virgo SFDs (filled blue dots) compared to the KINGFISH spirals and dwarfs (small and large grey squares), and the DGS (red-purple triangles). The solid line shows the relation determined by da Cunha et al. (2010) for an IRAS selected sample of local star-forming galaxies. The orange shaded area stands for the dispersion of the relation. Evolution of the Md − SFR relation for different amounts of dust mass destroyed by a single supernova event – Mcl = 100, 500, 1500 M⊙ – is indicated by the dotted, dashed, dot-dashed lines, respectively (Hjorth et al. 2014).
Current usage metrics show cumulative count of Article Views (full-text article views including HTML views, PDF and ePub downloads, according to the available data) and Abstracts Views on Vision4Press platform.
Data correspond to usage on the plateform after 2015. The current usage metrics is available 48-96 hours after online publication and is updated daily on week days.
Initial download of the metrics may take a while.