Fig. 10
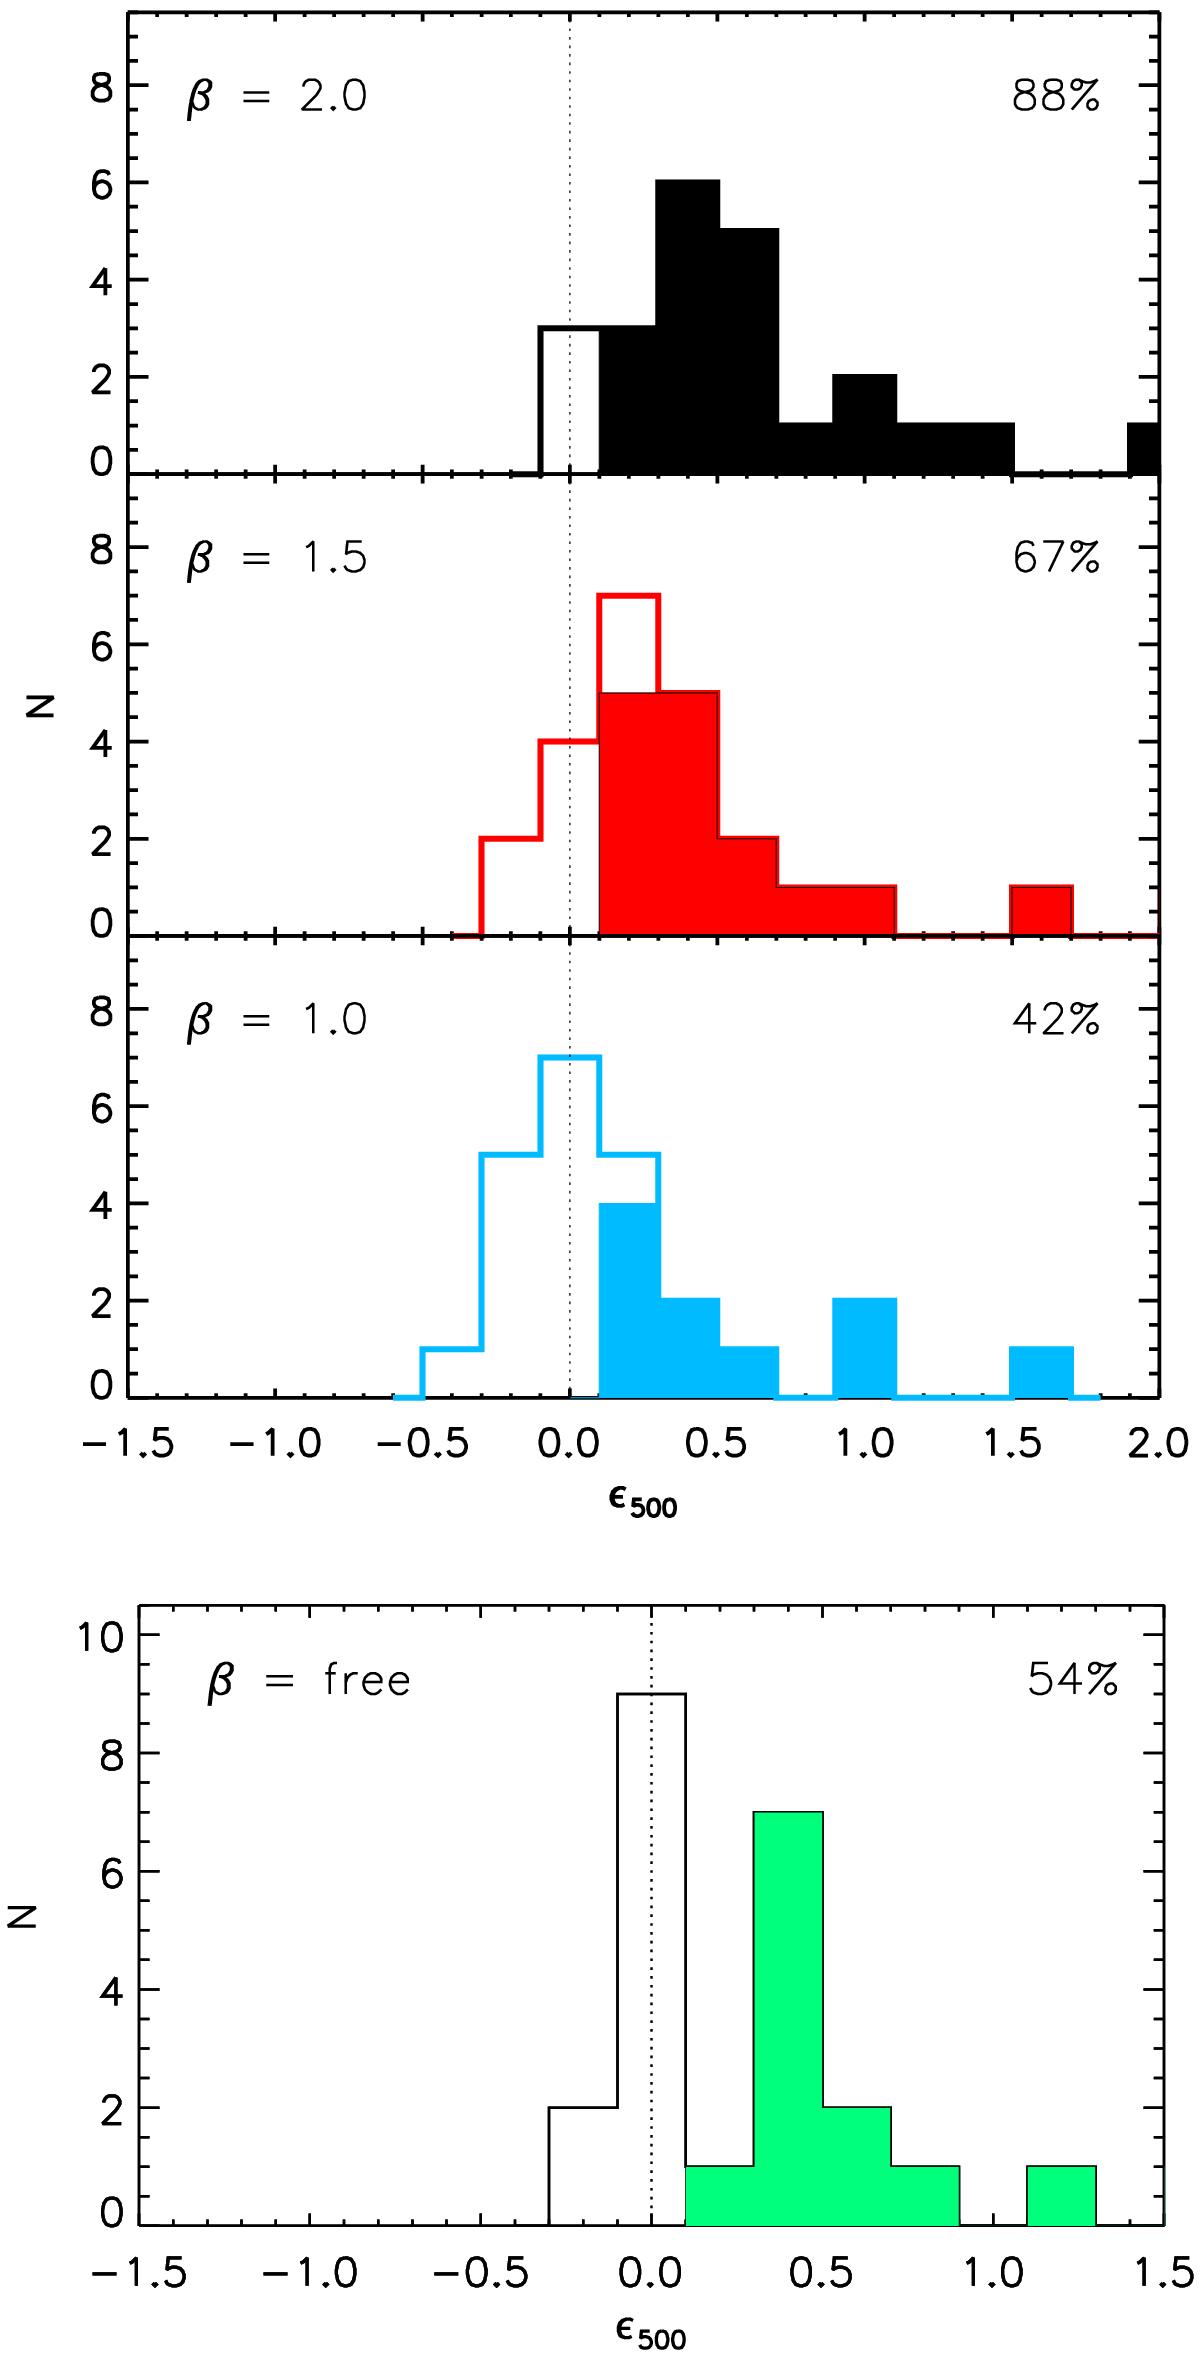
500 μm fractional residuals for fixed- and free-β MBB fitting. The filled histograms correspond to the galaxies whose 500 μm excess is larger than the error on the flux density measurement. The fraction of dwarfs with a submm excess is displayed at the top-right corner of each panel.
Current usage metrics show cumulative count of Article Views (full-text article views including HTML views, PDF and ePub downloads, according to the available data) and Abstracts Views on Vision4Press platform.
Data correspond to usage on the plateform after 2015. The current usage metrics is available 48-96 hours after online publication and is updated daily on week days.
Initial download of the metrics may take a while.