Fig. 4
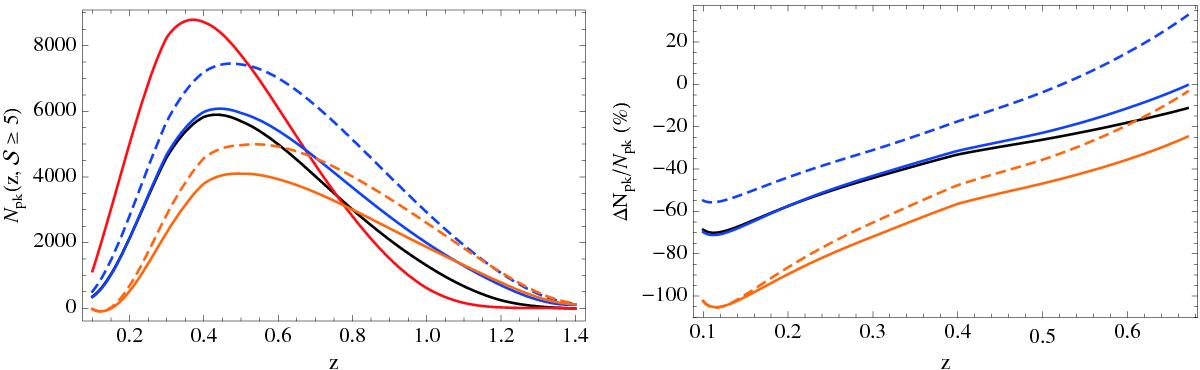
Left: number of peaks with ![]() in redshift bins of width Δz = 0.1 as a function of the bin redshift. Right: percentage deviation of the number of peaks per bin with respect to D08 (only reporting the range where
in redshift bins of width Δz = 0.1 as a function of the bin redshift. Right: percentage deviation of the number of peaks per bin with respect to D08 (only reporting the range where ![]() for D08 is significantly non-vanishing). Black, red, blue, dashed blue, orange, and dashed orange lines refer to B01, D08, Ok10, Ok10z, Og12, and Og12z, respectively.
for D08 is significantly non-vanishing). Black, red, blue, dashed blue, orange, and dashed orange lines refer to B01, D08, Ok10, Ok10z, Og12, and Og12z, respectively.
Current usage metrics show cumulative count of Article Views (full-text article views including HTML views, PDF and ePub downloads, according to the available data) and Abstracts Views on Vision4Press platform.
Data correspond to usage on the plateform after 2015. The current usage metrics is available 48-96 hours after online publication and is updated daily on week days.
Initial download of the metrics may take a while.