Fig. 3
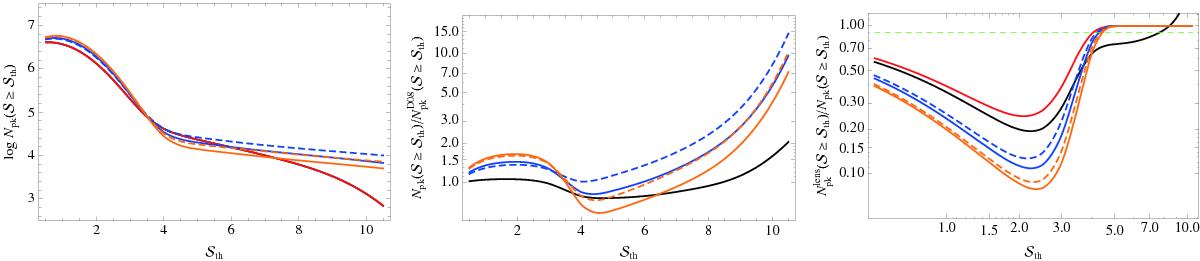
Left: total number of peaks as a function of the threshold S/N ![]() . Centre: same as before, but scaled with respect to the D08 fiducial MC relation. Right: ratio between the number of peaks due to clusters and the total one as a function of
. Centre: same as before, but scaled with respect to the D08 fiducial MC relation. Right: ratio between the number of peaks due to clusters and the total one as a function of ![]() . In each panel, black, red, blue, dashed blue, orange, and dashed orange lines refer to the B01, D08, Ok10, Ok10z, Og12, and Og12z MC relations.
. In each panel, black, red, blue, dashed blue, orange, and dashed orange lines refer to the B01, D08, Ok10, Ok10z, Og12, and Og12z MC relations.
Current usage metrics show cumulative count of Article Views (full-text article views including HTML views, PDF and ePub downloads, according to the available data) and Abstracts Views on Vision4Press platform.
Data correspond to usage on the plateform after 2015. The current usage metrics is available 48-96 hours after online publication and is updated daily on week days.
Initial download of the metrics may take a while.