Fig. 2
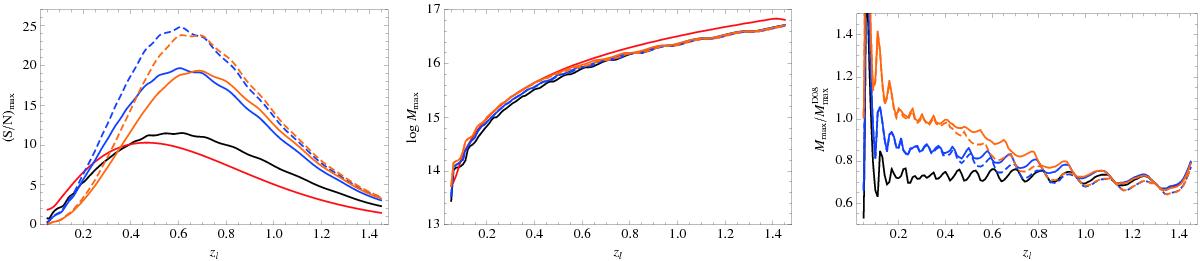
Maximum S/N (left) and virial mass log Mmax (centre) at which the S/N is maximised as a function of the cluster redshift. Right panel: Mmax normalised to the value for the D08 relation (wiggles are merely interpolation features). Black, red, blue, dashed blue, orange, and dashed orange lines refer to B01, D08, Ok10, Ok10z, Og12, and Og12z, respectively.
Current usage metrics show cumulative count of Article Views (full-text article views including HTML views, PDF and ePub downloads, according to the available data) and Abstracts Views on Vision4Press platform.
Data correspond to usage on the plateform after 2015. The current usage metrics is available 48-96 hours after online publication and is updated daily on week days.
Initial download of the metrics may take a while.