Fig. 9
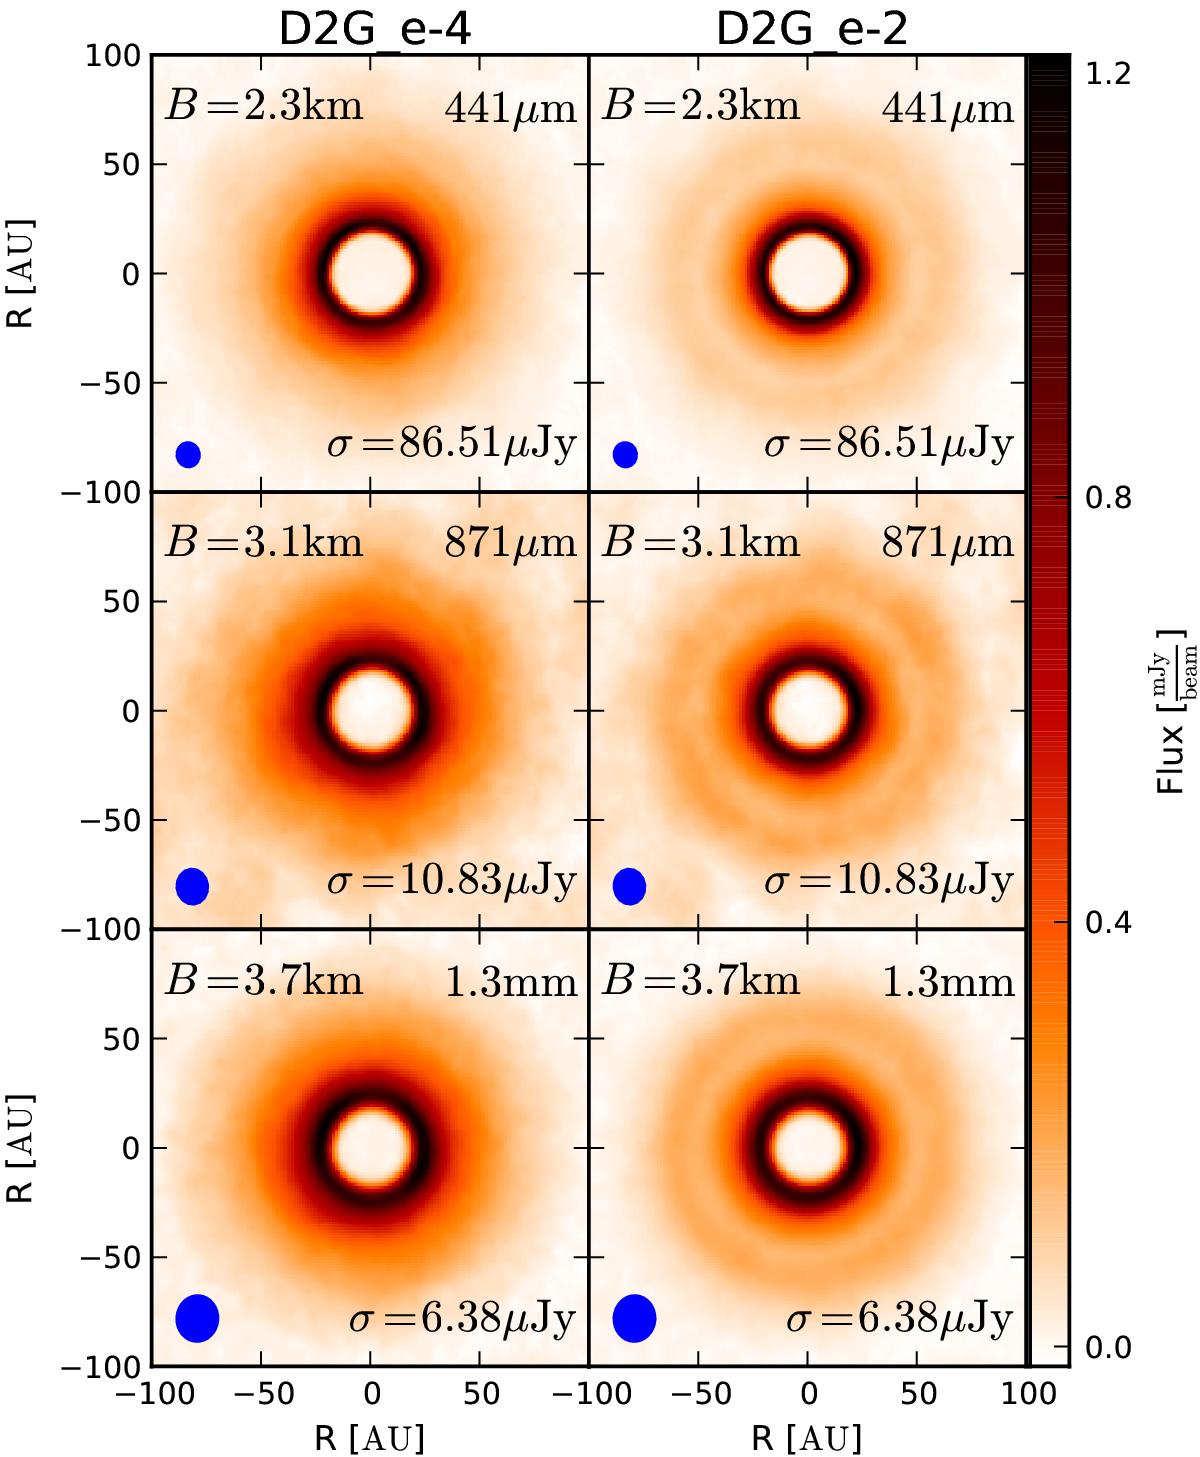
Selected simulated ALMA observations of the two disk models (left column: D2G_e-4, right column: D2G_e-2) at three different wavelengths (top: 441 μm, center: 871 μm, bottom: 1303 μm) at a distance of 75 pc. The longest baselines, synthesized beam sizes, and S/N are plotted into each panel. For comparison, the maps for model D2G_e-4 (left) are scaled with a factor 100.
Current usage metrics show cumulative count of Article Views (full-text article views including HTML views, PDF and ePub downloads, according to the available data) and Abstracts Views on Vision4Press platform.
Data correspond to usage on the plateform after 2015. The current usage metrics is available 48-96 hours after online publication and is updated daily on week days.
Initial download of the metrics may take a while.