Fig. 10
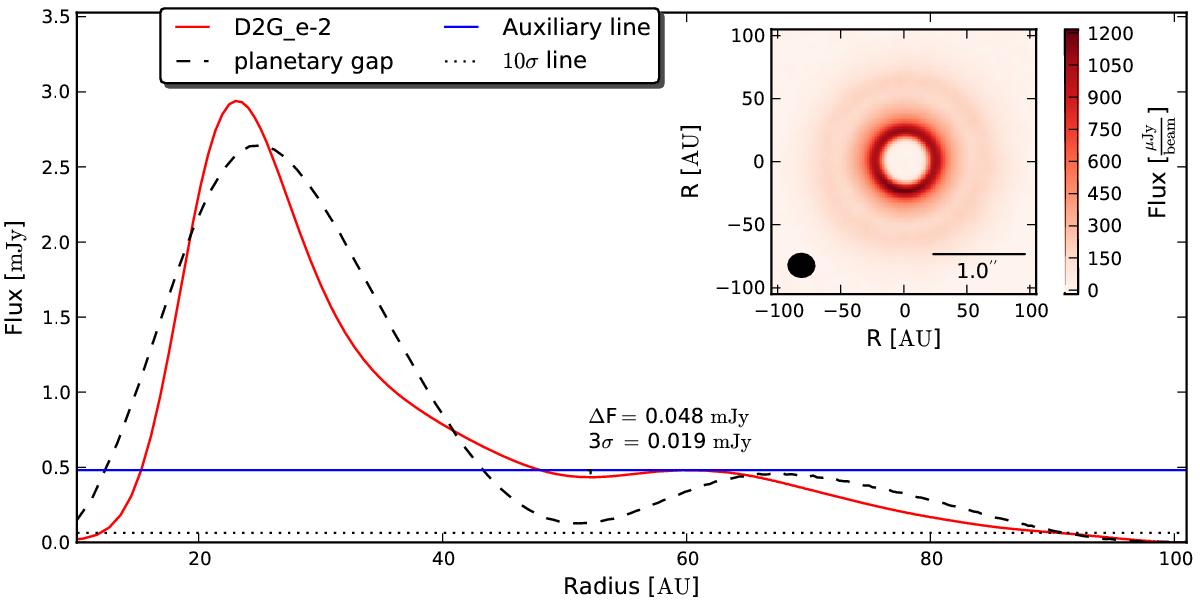
Radial brightness profile of a simulated ALMA map of model D2G_e-2 at a wavelength of 1.3 mm and a distance of 75 pc. Compared to the local flux maximum at 60 AU, the significance of the flux decrease at about 55 AU is 7.7σ. The dashed line shows the radial brightness profile of a disk that is perturbed by a giant planet with a planet-to-star mass ratio of 0.001. The remaining disk parameters correspond to model D2G_e-2. The 10σ level is indicated by the dotted line. The blue line is an auxiliary line that visualizes the maximum flux of the outer disk (red line) at any other location.
Current usage metrics show cumulative count of Article Views (full-text article views including HTML views, PDF and ePub downloads, according to the available data) and Abstracts Views on Vision4Press platform.
Data correspond to usage on the plateform after 2015. The current usage metrics is available 48-96 hours after online publication and is updated daily on week days.
Initial download of the metrics may take a while.