Fig. 1
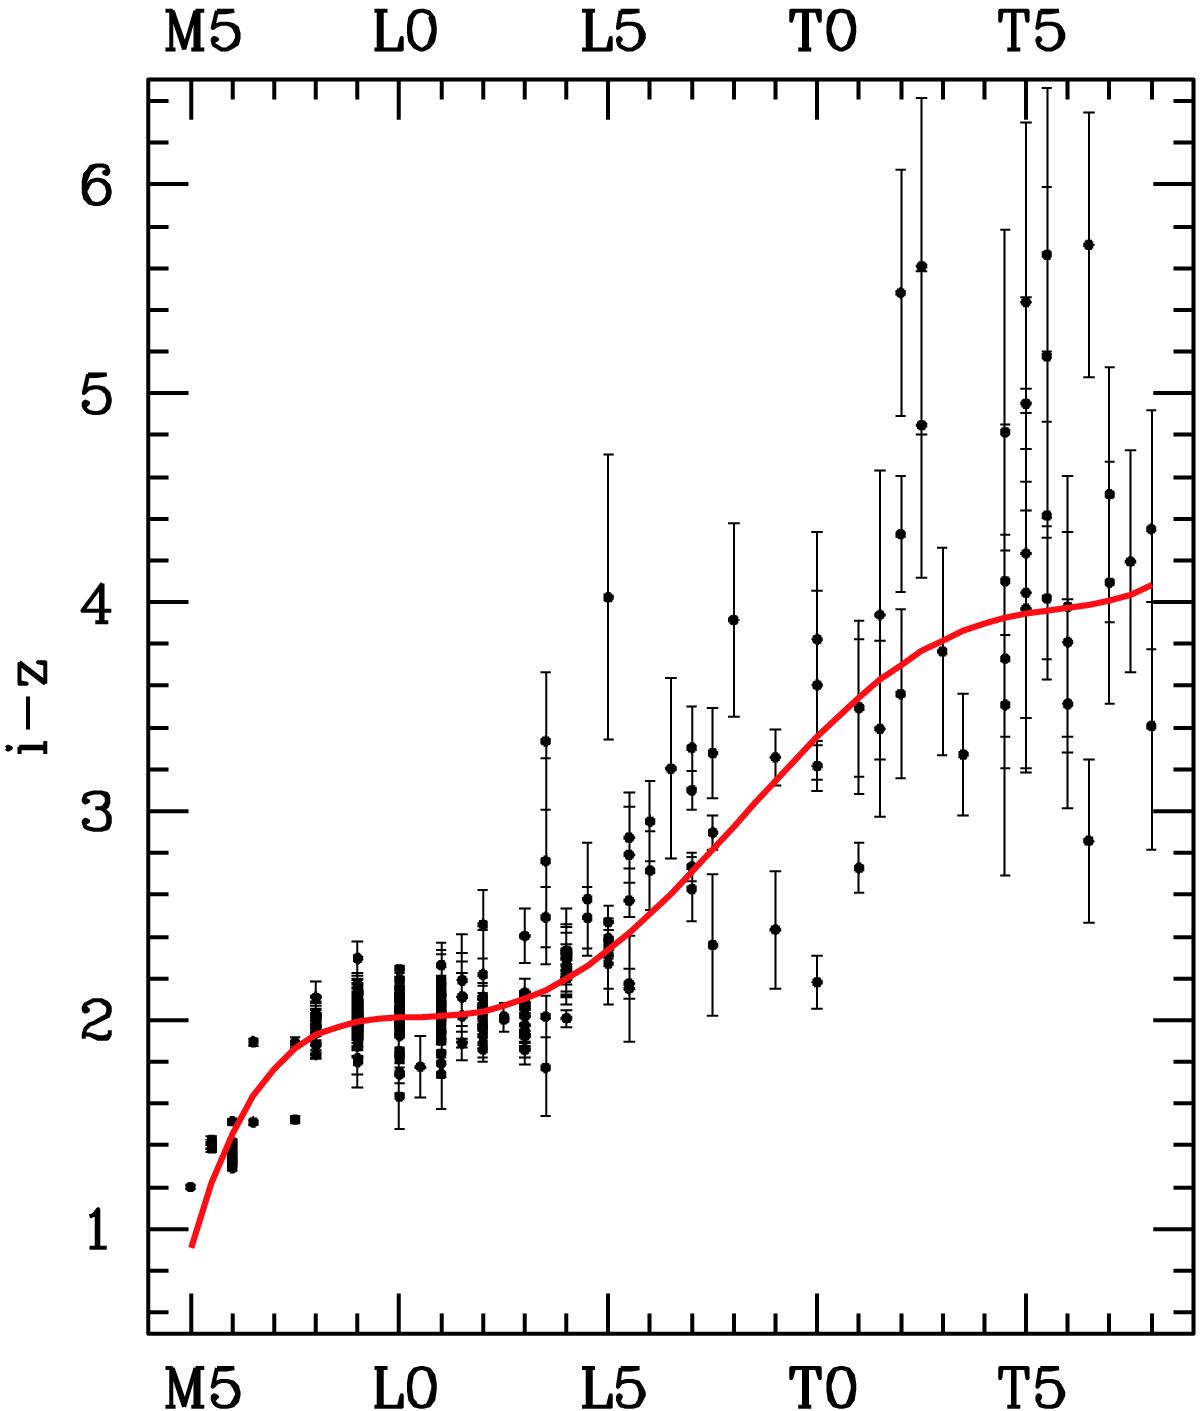
i − z colour vs. spectral sub-type for MLT dwarfs in the UKIDSS LAS DR10 footprint. The error bars plotted show the random photometric errors. The fitted curve provides the template colours listed in Table 1. In making the fit, a colour error of 0.07 mag. (i.e. 0.05 mag. in each band) is added in quadrature to the random photometric errors to account for intrinsic scatter in the colours. The very large errors in the T dwarf regime mean that the curve is poorly defined in this region, as discussed in the text. The vertical scale is the same as in Fig. 2. The outlying blue T0 dwarf is discussed in Sect. 3.2. All photometry is on the Vega system.
Current usage metrics show cumulative count of Article Views (full-text article views including HTML views, PDF and ePub downloads, according to the available data) and Abstracts Views on Vision4Press platform.
Data correspond to usage on the plateform after 2015. The current usage metrics is available 48-96 hours after online publication and is updated daily on week days.
Initial download of the metrics may take a while.