| Issue |
A&A
Volume 574, February 2015
|
|
|---|---|---|
| Article Number | A91 | |
| Number of page(s) | 6 | |
| Section | Planets and planetary systems | |
| DOI | https://doi.org/10.1051/0004-6361/201424482 | |
| Published online | 29 January 2015 | |
Research Note
In situ apparatus for the study of clathrate hydrates relevant to solar system bodies using synchrotron X-ray diffraction and Raman spectroscopy
1
Diamond Light Source, Harwell Science and Innovation Campus,
Didcot,
Oxfordshire
OX11 0DE,
UK
e-mail:
This email address is being protected from spambots. You need JavaScript enabled to view it.
2
Astrophysics Group, Keele University, Keele, Staffordshire, ST5
5BG, UK
Received: 26 June 2014
Accepted: 23 December 2014
Abstract
Context. Clathrate hydrates are believed to play a significant role in various solar system environments, e.g. comets, and the surfaces and interiors of icy satellites. However, the structural factors governing their formation and dissociation are poorly understood.
Aims. We demonstrate the application of a high pressure gas cell, combined with variable temperature non-contact cooling and fast, time-resolved data collection, to the in situ study of clathrate hydrates under conditions relevant to solar system environments.
Methods. Clathrates formed and processed within the sample cell are monitored in situ using time-resolved synchrotron X-ray powder diffraction and laser Raman spectroscopy.
Results. X-ray diffraction allows the formation of clathrate hydrates to be observed as CO2 gas is applied to ice formed within the cell. Complete conversion is obtained by annealing at temperatures just below the ice melting point. A subsequent rise in the quantity of clathrate is observed as the cell is thermally cycled. Four regions between 100−5000 cm-1 are present in the in situ Raman spectra that carry features characteristic of both ice and clathrate formation.
Conclusions. This novel experimental arrangement is well suited to studying clathrate hydrates over a wide range of temperature (80 −500 K) and pressure (1−100 bar) conditions relevant to solar system bodies and can be used with a variety of different gases and starting aqueous compositions (e.g. saline solutions). We propose the increase in clathrate formation observed during thermal cycling may be due to the formation of a quasi liquid-like phase that forms at temperatures below the ice melting point, but which allows either easier formation of new clathrate cages, or the retention and delocalisation of previously formed clathrate structures, possibly as amorphous clathrate. The structural similarities between hexagonal ice, the quasi liquid-like phase, and crystalline CO2 hydrate mean that differences in the Raman spectrum are subtle; however, all features out to 5000 cm-1, when viewed together, are diagnostic of clathrate structure.
Key words: comets: general / planets and satellites: surfaces / planets and satellites: composition / techniques: spectroscopic
© ESO, 2015
1. Introduction
Clathrate hydrates are compound structures consisting of water-ice in which water molecules form cage structures enclosing gas molecules (referred to as the host and guest molecules, respectively). They are stable only in specific temperature and pressure regimes that depend on the size of the guest species, and the structure of the ice cages themselves (see Sloan 1998, 2003, for reviews). Clathrates can form three independent structures that are determined by the size and shape of the cages formed. Structure I (sI) clathrates form a cubic crystal structure of space group Pm-3n and are characterised by two cage types, namely 512 (i.e. constructed of 12 pentagonal faces) and the larger 51262 (i.e. 12 pentagonal and 2 hexagonal faces). They consist of two small cages to every six large cages, and typically host comparatively large guest molecules such as CO2 and CH4. Structure II (sII) clathrates incorporate smaller molecules such as O2 and N2, forming sixteen small 512 cages and eight large 51264 cages. Structure H (sH) clathrates are less common, consisting of three small cages, two medium cages, and one large cage per unit cell, and require two guest species to fill the cages in order to remain stable.
 |
Fig. 1 a) High-pressure cell used to produce clathrates by injecting gas into ice formed by the in situ freezing of water. b) Experimental arrangement for collecting in situ, variable temperature SXPD and Raman spectroscopic data on clathrate hydrates. |
It is suggested that clathrates play an important role in the distribution and total inventory of Martian volatiles, including methane and noble gases (Xe, Ar, Kr), and that the dissociation of extensive sub-surface clathrate deposits could be responsible for some of the geomorphological features observed on the surface of the planet (Chassefière et al. 2013; Mousis et al. 2013). They have similarly been suggested as a mode of depletion for the noble gases in the atmosphere of Titan (Mousis et al. 2009, 2011), and as the source of the nitrogen depletion observed in comets (Iro et al. 2003). Clathrate hydrates are also believed to be present in large quantities within a sub-surface ocean on Enceladus, and have been suggested as a possible source for the energetic plumes emanating from its surface (Porco et al. 2006). Many volatile species have been detected within these plumes, including CO2, CH4, and N2 – as have organics (Waite et al. 2009) – and, with the exception of CO2, these gases have very poor solubility in liquid water. It is therefore considered likely that they exist below the surface in the form of clathrate hydrates. The likely role of clathrates in the presence of volatile species and noble gases in the evolution of Mars and its atmosphere has been reviewed by Mousis et al. (2013); while a summary of CO2 clathrate hydrates in the context of planetary, satellite and cometary environments is given by Dartois & Schmitt (2009), who presented 1.96−4.43 μm Infrared (IR) spectra at a number of temperatures between 5.6 K and 150 K for CO2 clathrates initially formed at 255 K and 20 bar CO2 pressure (see also Oancea et al. 2012). Dartois & Schmitt note the potential difficulties associated with carrying out in situ IR spectroscopy of clathrates in view of their likely location on planetary etc. surfaces and sub-surface regions and their near-inaccessibility to landers. Raman spectra for CO2 clathrates at high pressures (representing clathrate deposits deep within the interior of these icy bodies) have been obtained by Bollengier et al. (2013) over the 0−1.7 GPa and 250 –330 K pressure and temperature ranges.
Based on thermodynamic calculations, numerous models have been developed for the stability of clathrate hydrates on Europa (Prieto-Ballesteros et al. 2005; Hand et al. 2006), Enceladus (Fortes 2007), and Titan (Mousis et al. 2011), as well as comets (Marboeuf et al. 2010); however, despite clathrate hydrates having a long history of investigation, the available experimental data at the relevant temperatures and pressures necessary to confirm the accuracy, or otherwise, of these models is still limited. Ambuehl & Elwood Madden (2014) recently performed detailed kinetic studies of CO2 clathrate hydrate formation/dissociation over a temperature and pressure range relevant to the surface of Mars. However, this experiment was based solely on bulk gas consumption measurements and therefore contributions from microscale structural processes at different temperature and pressure conditions are not taken into account. Understanding the fundamental structural changes that occur during the formation and subsequent break down of the hydrate cages is essential to the understanding of clathrates in different environments and their utility for gas sequestration. Choukroun et al. (2010) used Raman spectroscopy, coupled with a liquid nitrogen cooled sapphire anvil cell, to study the stability of methane clathrates in relation to the outgassing of methane on the surface of Titan covering 240−320 K and 0−800 bar. However, operationally the setup of the sapphire anvil cell and initial clathrate formation is a difficult multi-step process. Other in situ studies of clathrate hydrates have been performed using synchrotron X-ray diffraction (Koh et al. 1996; Takeya et al. 2000a; Uchinda et al. 2003) and neutron diffraction (Henning et al. 2000; Koh et al. 2000). However, these studies have predominantly focused on the stability regimes of clathrate hydrates in relation to terrestrial clathrate deposits e.g. hydrate occurances in gas and oil pipelines and in Arctic permafrost. The temperature and pressure ranges of these experiments are not directly comparable to solar system environments. In addition, kinetic studies show that, while complete conversion of ice to clathrate is a slow process, depending on temperature and pressure, the initial rate of formation can be rapid (a few minutes; Ambuehl & Elwood Madden 2014; Falenty et al. 2013; Gainey & Elwood Madden 2012). Similarly, the dissociation of clathrates can occur over very short timescales (Gainey & Elwood Madden 2012). To understand the structural process governing clathrate formation fast data collection times (few s) are thus required. Previous studies presenting time-resolved data have been limited by collection times of 200 s (Koh et al. 1996) or more (300−900 s; Uchinda et al. 2003; Takeya et al. 2000a; Henning et al. 2000).
Using high-brightness synchrotron X-ray radiation and a fast detector we are able, using the in situ cell, to acquire time-resolved structural data typically on a scale of ~20 s or less, allowing the formation and dissociation processes of clathrate hydrates, at variable temperatures, to be observed in situ. In this note we describe the apparatus used for, and present the results of, test measurements showing its suitability for studying clathrate hydrate evolution over temperature and pressure ranges relevant to many solar system bodies.
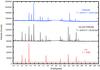 |
Fig. 2 X-ray powder diffraction patterns for ice at 200 K in air at ambient pressure (bottom), ice and CO2 clathrate mixture at 220 K and CO2 pressure 20.42 bar (middle) and pure CO2 clathrate at 253 K and CO2 pressure 20.42 bar (top). The strong reflection at ~20° 2θ due to the sapphire capillary has been removed from the data. |
2. Experimental
The experimental work was carried out at Diamond Light Source Beamline I11 (Thompson et al. 2009). The high pressure sample cell employs  Swagelok fittings, mounted into a stainless steel body with bracing supports (Fig. 1a). Deionised water (18.2 MΩ) was loaded into a 0.8 mm diameter single-crystal sapphire tube which is then sealed into the cell by vespel ferrules drilled to match the diameter of the tube. The sample cell is mounted horizontally onto the central θ circle of a vertical concentric three circle diffractometer. The sample tube is aligned with the instrument’s centre of rotation using a goniometer mount and the gas cell itself is connected to a gas delivery system containing a turbo pump allowing for multiple gas dosing/evacuation cycles (Parker et al. 2012). Sample cooling is provided by a LN2 Cryostream (Oxford Cryosystems), and X-ray diffraction data were collected in the azimuthal plane using the beamline’s 90° arc position sensitive detector (Thompson et al. 2011). A schematic of the experimental arrangement is shown in Fig. 1b. Using the gas cell and LN2 Cryostream it is in principle possible to simulate a wide range of temperature and pressure conditions (80−500 K, 1−100 bar), such as those found in solar system environments (e.g. at the surface of Titan and at depth within the sub-surface ocean on Enceladus and Europa). The in situ Raman system consists of a 532 nm laser, Raman probe with a long working length objective lens (65 mm working distance), mounted on a motorised linear drive located on a sample table next to the diffractometer and connected to a iHR550 imaging spectrometer. For the present work the X-ray wavelength was 0.826411 Å, calibrated against NIST SRM640c standard Si powder and the beam size at the sample was 2.5 mm (horizontal) ×0.8 mm (vertical). To improve sampling statistics and compensate for preferred crystal orientation effects resulting from the starting solution being frozen in situ, the sample cell was rocked ± 15° about its length using the diffractometer’s θ-circle motion during diffraction data collection. The standard angular speed for this circle on the I11 diffractometer is 4° s-1, and (compensating for acceleration and deceleration at either end of the rock) requires ~10 s to complete one full ±15° rotation. To compensate for the small gaps between the 18 Si-strip detector modules that comprise the I11 position sensitive detector, two 10 s exposures were made with the detector position offset by 0.25°. Data collection times were 20 s for the X-ray diffraction and 10−15 s for Raman. Owing to space limitations at the sample point, simultaneous SXPD and Raman measurements cannot be performed, instead the Raman probe is remotely driven in and out of position as required, allowing Raman spectra to be collected between SXPD scans. Therefore for the present work, SXPD was used to monitor ice/clathrate formation for temperature-CO2 pressure combinations and complementary Raman spectra up to 5000 cm-1 were obtained at crucial points of interest, though the reverse procedure could equally be followed.
The sapphire tubes, loaded with deionised water, were mounted in the gas cell and aligned with the X-ray beam. The conversion of ice to clathrate is a temperature-dependent process (Henning et al. 2000) and once frozen at 200 K, forming a hexagonal ice phase (Ih), the ice was exposed to high purity CO2 (99.98%) at 20.4 bar. Following the gas injection, conversion of the ice to clathrate was achieved by increasing the temperature towards the melting point of ice; at 253 K the ice diffraction features disappeared. The sample was then refrozen by lowering the temperature to 200 K. The formation of the clathrate is immediately evident from the growth of multiple features (14−19°, 21.4°, 23−24°, 24.6°, and 25.2° 2θ; see Fig. 2). Clathrate features were first observed at a temperature of 220 K. For the purpose of demonstrating the cell’s capability, once clathrates had formed, the temperature was cycled between 200−280 K, to determine the effect that repetitive cycling would have on the clathrate structure. Finally, the temperature was held at 270 K while the pressure was steadily decreased in order to observe their dissociation.
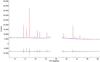 |
Fig. 3 Rietveld refinement produces a good fit to the experimental data. The experimental data are shown in blue, the calculated fit in red and the residuals in grey below. The strong reflection between 19−21° 2θ, due to the sapphire capillary, has been excluded from the refinement. |
3. Results
3.1. SXPD
Figure 2 provides a comparison of the X-ray diffraction patterns for pure Ih, mixed ice and CO2 clathrate, and pure CO2 clathrate, for the conditions specified in the figure caption. Rietveld structure refinement (Rietveld 1969), using TOPAS refinement software (Version 4.2, Bruker AXS), of the uppermost scan in Fig. 2 (the clathrate at T = 253 K and P = 20.42 bar) confirmed the clathrate phase to be cubic, with a lattice parameter of 11.964 ± 0.001 Å and unit cell volume of 1712.8(4) Å3; this is consistent with previously reported sI clathrate structures at this temperature (e.g. Udachin et al. 2001; Takeya et al. 2010). A good fit was obtained, with agreement factors of Rwp = 2.82% and Rexp = 1.31%, producing a goodness of fit value of 2.15. Figure 3 shows the fit to the experimental data.
3.2. Raman spectroscopy
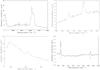 |
Fig. 4 Top left: Raman spectrum of CO2 clathrate hydrate at 260 K. Main feature at ~3200 cm-1 is due to O−H stretch. Boxed regions are expanded in adjacent plots. Top right: close-up of main Raman spectrum in the range 1200−1500 cm-1, showing ~1280 cm-1 and ~1390 cm-1 features. Bottom left: close-up in the range 50−350 cm-1, showing ~220 cm-1 feature. Bottom right: close-up in the range 1600−5500 cm-1, showing ~1753 cm-1 and ~2341 cm-1 features. See text for details. |
Raman spectra were obtained in situ and Fig. 4 shows the main features indicative of CO2 clathrates; these data were obtained at 260 K and 20 bar CO2 pressure. The dominant feature at ~3200 cm-1 (see Fig. 4, top left) is due to the well-known O−H stretch and varied little between the clathrate and Ih ice phase, when observed over a temperature and pressure range of 220−270 K and 0−20 bar. The shape of the O−H stretching bands (and inter-molecular hydrogen bond vibration bands) however, does depend on the structure of the hydrate. For example, sII clathrates contain twice as many small 512 cages as large 51264 ones, whereas the ratio of small cages to large cages in sI hydrates is 1:3. The predominance of large cages – and the associated higher ratio of hexagons to pentagons – induce an orientation of the water molecules and vibrational behaviour in sI clathrate, in the region of 3200 cm-1, that is similar to water molecules hydrogen bonded in ice. On the other hand, the predominance of small cages in sII clathrates results in a band profile that is more similar to liquid water (Sum et al. 1997; Ikeda et al. 1998). This means that, when taken in conjunction with other features (see below), the Raman spectrum of the H2O molecule is a good indicator for the clathrate structure (Schicks et al. 2005).
The feature at ~220 cm-1 (see Fig. 4, bottom left) is due to the inter-molecular O−O vibration mode of the water molecules forming the clathrate structure (Nakano et al. 1998). This feature is shown in greater detail in Fig. 5 for ice, ice plus clathrate, and clathrate, for which the peak wavenumbers are 223.1 ± 0.5 cm-1, 218.8 ± 0.3 cm-1, and 216.2 ± 0.3 cm-1, respectively. These values are consistent with this feature (unlike the above O−H stretch features) being sensitive to environmental changes (Nakano et al. 1998): over the pressure range ~100−5000 bar the Raman shift varies from ~205 cm-1 to ~224 cm-1. Nakano et al. also note that the 220 cm-1 O−O feature is specific to the CO2 clathrate hydrate; this can be explained by the structural similarities between the hydrogen bonded H2O structures of sI clathrate and ice, in that both liquid water and sII clathrate show only weak broad features in this region.
The features at ~1280 cm-1 and ~1390 cm-1 (Fig. 4, top right) are the CO2 Fermi diad ω1:2ω2 resonance in CO2 molecules trapped within the clathrate cages; we note that, in pure crystalline CO2 at 6 K, these features appear at 1275.7 ± 0.1 cm-1 and 1384.0 ± 0.1 cm-1 ( ), and 1276.1 ± 0.1 cm-1 and 1384.0 ± 0.1 cm-1 (
 ) (Ouillon et al. 1985). Nakano et al. (1998) found that there is little or no pressure-dependence of the Raman shift for the Fermi diad features, up to a pressure of ~5000 bar. On the other hand, these features are sensitive to isotopic composition, at least in the fluid state (Irmer & Graupner 2002; Windisch et al. 2012). In the vapour phase the Raman spectrum of CO2 shows two major, narrow Fermi diad bands and two minor bands – denoted as hot bands – which are coupled through Fermi resonance. When CO2 is incorporated into the hydrate lattice, the major bands are still very pronounced; however, the hot bands convolute into the Fermi diad bands, contributing only to the asymmetric tails of the bands observed in Fig. 4, top right (Sum et al. 1997). No splitting of the diad bands was observed in our data, showing that the CO2 molecules occupy only the large cavity, as originally suggested by Ratcliffe & Ripmeester (1986).
The Fermi diad at ~1280 cm-1 and ~1390 cm-1, and the 220 cm-1 and the 3200 cm-1 OH band features can therefore be used as complementary indicators not only of the presence of clathrate hydrates in astrophysical environments, but (in the case of the Fermi diad bands) also of C and O isotopic ratios (Irmer & Graupner 2002; Windisch et al. 2012) and of the nature of the clathrate environment itself.
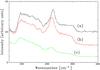 |
Fig. 5 Raman spectrum of a) ice at 10 bar CO2 pressure and temperature 225 K; b) ice plus clathrate at 10 bar CO2 pressure and temperatue 265 K; c) CO2 clathrate hydrate at 260 K. All in the region of the 220 cm-1 O−O feature. |
3.3. Thermal and pressure cycling
We performed thermal cycling of the clathrates to demonstrate the feasibility of using the gas cell setup to simulate temperature variations on planetary bodies, such as might occur during day/night cycles, seasonal variations, or the tidal stressing that occurs on Enceladus (e.g. Hedman et al. 2013). A total of four cycles were performed, each within the temperature range 200−253 K; see Fig. 6 for details. In this figure the peak intensity of the 320 clathrate X-ray reflection is taken as a proxy for the formation and destruction of the clathrate, and the abscissa is given in terms of the time since first cooling to 200 K. A clear and systematic increase in the peak intensity of the 320 peak with each cycle is observed. As the sample volume in the beam is unchanged as the temperature is cycled (apart from negligible thermal expansion effects), this clearly indicates that, on each cycle, the proportion of CO2 clathrate hydrate is increasing, suggesting that more CO2 is being incorporated into clathrate. A plausible explanation centres on the behaviour of the ice near its melting point. Firstly, as the melting point is approached, the ice forms a quasi liquid-like medium surrounding the clathrate (Mizuno & Hanafusa 1987; Henning et al. 2000), allowing for increased inward diffusion (compared to diffusion through clathrate) of additional CO2 from the environment. Secondly, since measured Raman shifts of the CO2 molecule dissolved in the liquid phase are very close to those of CO2 in the clathrate phase the structure of water around CO2 in the liquid phase is likely to be similar to that of the hydrate cage (Nakano et al. 1998), suggesting that hydrate formation is easier/faster in the quasi liquid-like phase. Molecular dynamics simulations (Jacobson et al. 2010, 2011) of clathrate formation from the liquid phase suggest that crystalline clathrates result from a multi-step process. The first step involves solvent separated clusters of the guest molecules in which the water molecules reorganise to produce polyhedral clathrate cages, resulting in the formation of an amorphous clathrate nucleus. The amorphous nucleus then either reorganises into a crystalline nucleus and grows a crystalline clathrate, or a crystal grows directly around the precursor amorphous seed. These simulations suggest that nucleation of clathrates under conditions of high supercooling, at temperatures well below the melting temperature of the amorphous clathrate, can result in the formation of a metastable amorphous clathrate phase. The ongoing formation/survival of amorphous clathrate precursors, or water molecule cage structures (Takeya et al. 2000b), could be the origin of the so-called memory effect reported by certain authors, whereby water that has been previously frozen, or has previously formed hydrate and then thawed, will form hydrate more readily a second time (Takeya et al. 2000b; Ohmura et al. 2003) thus increasing the subsequent rate of formation. The forming of a quasi liquid-like medium below the melting point would allow delocalisation of already formed hydrate cages within the ice to easily occur, generating an active surface for forming additional clathrate by allowing delocalised, previously unincorporated and amorphous hydrate, along with newly formed hydrate cages from the external gas, to attach to the growing clathrate structure. All of these factors contribute to maintaining an apparently high ice to (crystalline) clathrate reaction rate (Kawamura et al. 2002). Since the rate of clathrate formation is slower at low temperatures, this would suggest that those otherwise cold solar system objects that experience only brief or intermittent warming events could, nevertheless, over cosmic timescales still build up extensive clathrate deposits that may be a mixture of amorphous and crystalline phases.
To demonstrate the effect of a decrease in pressure on the clathrate structure, we fixed the temperature at 253 K and, starting from a pressure of 20 bar, we reduced the pressure in steps of 5 bar. We found that a reduction in pressure below 10 bar resulted in rapid (≲ 20 min) dissociation of the clathrates, as shown in Fig. 7. The rapid removal of clathrate as the pressure falls may be relevant to the production of plumes observed on bodies such as Enceladus, where it is proposed that the plumes could result from removal of surface pressure, causing sudden dissociation of clathrates. The sudden dissociation of such sub-surface clathrate hydrates could be due to a rapid drop in pressure through surface ice fracturing (Keiffer et al. 2006).
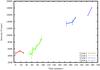 |
Fig. 6 Effect of thermal cycling on the intensity of the 320 clathrate peak, seen at 14.3° in Fig. 2. Cycle 1: 200−245 K. Cycle 2: 210−230 K. Cycle 3: 220−240 K. Cycle 4: 220−250 K. |
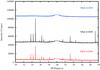 |
Fig. 7 Pressure-dependence of CO2 clathrate hydrate. As in Fig. 2 a strong feature at ~20° 2θ due to the sapphire capillary has been removed. |
4. Conclusion
We have demonstrated the use of a simple, easy to use gas cell for the formation of CO2 clathrates combined with in situ, time-resolved SXPD and in situ Raman spectroscopy. The experimental setup has great potential for studying the formation and stability of clathrate hydrates in astrophysical, particularly solar system, environments. We have presented the results of example measurements to demonstrate its suitability for such work. While the results presented here were performed using pure H2O and only CO2 gas, the cell can be used with various gases (e.g. N2, CH4, Kr, Xe, and Ar), with multiple gas dosing cycles and different initial liquid compositions (e.g. saline solutions), under a wide range of applied environmental conditions of temperature and pressure (80−500 K, 1−100 bar), providing a novel experimental resource for the study of clathrate hydrates.
Raman features in the 100−5000 cm-1 range are, when taken as a whole, all diagnostic of clathrate formation, while the weak Raman features at ~220 cm-1 are sensitive to changes in environmental conditions. These features could potentially be used as identifiers of clathrate hydrates or to determine environmental conditions using Raman spectrometers on future planetary landers.
The formation of clathrates at temperatures < 200 K was found to be extremely slow and, within the time frame of the beamtime allocation, could not be observed. However, we plan to conduct further experiments at these lower temperatures on the recently commissioned Long Duration Experiment facility on Beamline I11 at Diamond, which allows the in situ processing and monitoring of samples held under slowly varying conditions on a timescale of months to years.
Acknowledgments
This work was supported by the Diamond Light Source through beamtime award EE-8037. S.J.D. acknowledges support from Keele University and Diamond Light Source. The authors would like to extend their thanks to the anonymous referee for their helpful and constructive comments on an earlier version of this paper.
References
- Ambuehl, D., & Elwood Madden, M. 2014, Icarus, 234, 45 [NASA ADS] [CrossRef] [Google Scholar]
- Bollengier, O., Choukroun, M., Grasset, O., et al. 2013, Geochim. Cosmochim. Acta, 119, 322 [NASA ADS] [CrossRef] [Google Scholar]
- Choukroun, M., Grasset, O., Tobie, G., et al. 2010, Icarus, 205, 581 [NASA ADS] [CrossRef] [Google Scholar]
- Chassefière, E., Dartois, E., Herri, J.-M., et al. 2013, Icarus, 223, 878 [NASA ADS] [CrossRef] [Google Scholar]
- Dartois, E., & Schmitt, B. 2009, A&A, 504, 869 [NASA ADS] [CrossRef] [EDP Sciences] [Google Scholar]
- Falenty, A., Salamatin, A. N., & Kuhs, W. F. 2013, J. Phys. Chem. C, 117, 8443 [CrossRef] [Google Scholar]
- Fortes, A. D. 2007, Icarus, 191, 743 [NASA ADS] [CrossRef] [Google Scholar]
- Gainey, S. R., & Elwood Maddedn, M. E. 2012, Icarus, 218, 513 [NASA ADS] [CrossRef] [Google Scholar]
- Geiger, A., Stillinger, F. H., & Rahman, A. 1979, J. Chem. Phys., 70, 4185 [NASA ADS] [CrossRef] [Google Scholar]
- Hand, K. P., Chyba, C. F., Carlson, R. W., et al. 2006, Astrobiol., 6, 463 [NASA ADS] [CrossRef] [Google Scholar]
- Hedman, M. M., Gosmeyer, C. M., Nicholson, P. D., et al. 2013, Nature, 500, 182 [NASA ADS] [CrossRef] [Google Scholar]
- Henning, R. W., Schultz, A. J., Thieu, V., et al. 2000, J. Phys. Chem. A, 104, 5066 [CrossRef] [Google Scholar]
- Irmer, G., & Graupner, T. 2002, Proc. 5th International Conf. on Raman spectroscopy applied to the earth sciences, Acta Universitatis Carolinae, Geologica, 46, 35 [Google Scholar]
- Iro, N., Gautier, D., Hersant, F., et al. 2003, Icarus, 161, 511 [NASA ADS] [CrossRef] [Google Scholar]
- Ikeda, T., Mae, S., & Uchida, T. 1998, J. Chem. Phys., 108, 1352 [NASA ADS] [CrossRef] [Google Scholar]
- Jacobson, L. C., Hujo, W., & Molinero, V. 2010, J. Am. Chem. Soc. 132, 11806 [CrossRef] [PubMed] [Google Scholar]
- Jacobson, L. C., Matsumoto, M., & Molinero, V. 2011, J. Chem. Phys. 135, 074501 [NASA ADS] [CrossRef] [Google Scholar]
- Kawamura, T., Komai, T., Yamamoto, Y., et al. 2002, J. Cryst. Growth, 234, 220-226 [NASA ADS] [CrossRef] [Google Scholar]
- Kieffer, S. W., Lu, X., Bethke, C. M., et al. 2006, Science, 314, 1764 [NASA ADS] [CrossRef] [PubMed] [Google Scholar]
- Koh, C. A., Savidge, J. L., & Tang, C. C. 1996, J. Phys. Chem., 100, 6412 [CrossRef] [Google Scholar]
- Koh, C. A., Wisbey, R. P., Wu, X., et al. 2000, J. Chem. Phys., 113, 6390 [NASA ADS] [CrossRef] [Google Scholar]
- Marboeuf, U., Mousis, O., Petit, J.-M., et al. 2010, ApJ, 708, 812 [NASA ADS] [CrossRef] [Google Scholar]
- Mizuno, Y., & Hanafusa, N. 1987, J. Phys., Colloq., C1 Suppl., 48, 511 [Google Scholar]
- Mousis, O., Lunine, J. I., Thomas, C., et al. 2009, ApJ, 691, 1780 [NASA ADS] [CrossRef] [Google Scholar]
- Mousis, O., Lunine, J. I., Picaud, S., et al. 2011, ApJ, 740, L9 [NASA ADS] [CrossRef] [Google Scholar]
- Mousis, O., Chassefière, E., Lasue, J., et al. 2013, Space Sci. Rev., 174, 213 [NASA ADS] [CrossRef] [Google Scholar]
- Nakano, S., Moritoki, M., & Ohgaki, K. 1998, J. Chem. Eng. Data, 43, 807 [CrossRef] [Google Scholar]
- Oancea, A., Grasset, O., Le Menn, E., et al. 2012, Icarus, 221, 900 [NASA ADS] [CrossRef] [Google Scholar]
- Ohmura, R., Ogawa, M., Yasuoka, K., et al. 2003. J. Phys. Chem. B 107, 5289 [Google Scholar]
- Ouillon, R., Ranson, P., & Califano, S. 1985, J. Chem. Phys., 83, 1 [CrossRef] [Google Scholar]
- Parker, J. E., Potter, J., Thompson, S. P., et al. 2012, Materials Science Forum, 706, 1707 [CrossRef] [Google Scholar]
- Plummer, P. L. M., & Chen, T. S. 1983, J. Phys. Chem., 87, 4190 [CrossRef] [Google Scholar]
- Plummer, P. L. M., & Chen, T. S. 1987, J. Chem. Phys., 86, 7149 [NASA ADS] [CrossRef] [Google Scholar]
- Porco, C. C., Helfenstein, P., Thomas, P. C., et al. 2006, Science, 311, 1393 [NASA ADS] [CrossRef] [PubMed] [Google Scholar]
- Prieto-Ballesteros, O., Kargel, J. S., Fernández-Sampedro, M., et al. 2005, Icarus, 177, 491 [NASA ADS] [CrossRef] [Google Scholar]
- Ratcliffe, C. I., & Ripmeester, J. A. 1986, J. Chem. Phys., 90, 1259 [CrossRef] [Google Scholar]
- Rietveld, H. M. 1969, J. Appl. Crystallography, 2, 65 [CrossRef] [Google Scholar]
- Schicks, J. M., Erzinger, J., & Ziemann, M. A. 2005, Spectrochim. Acta A, 62, 2399 [NASA ADS] [CrossRef] [Google Scholar]
- Sloan, E. D. 1998, Clathrate hydrates of natural gases, second edition (New York: Marcel Dekker Inc.) [Google Scholar]
- Sloan, E. D. 2003, Nature, 426, 353 [NASA ADS] [CrossRef] [PubMed] [Google Scholar]
- Sum, A. K., Burruss, R. C., Sloan, E. D. 1997, J. Phys. Chem. B., 101, 7371 [CrossRef] [Google Scholar]
- Takeya, S., Hori, A., Hondoh, T., et al. 2000b, J. Phys. Chem. B, 104, 4164 [CrossRef] [Google Scholar]
- Takeya, S., Hondoh, T., & Uchida, T. 2000a, Annals of the New York Science Academy, 912, 973 [NASA ADS] [CrossRef] [Google Scholar]
- Takeya, S., Kida, M., Minami, H., et al. 2006, Chem. Eng. Sci., 61, 2670 [CrossRef] [Google Scholar]
- Takeya, S., Konstantin, A. U., Moudrakovski, I. L., et al. 2010, J. Amer. Chem. Soc., 132, 524 [CrossRef] [Google Scholar]
- Thompson, S., Parker, J., Potter, J., et al. 2009, Rev. Sci. Instrum., 80, 075107 [Google Scholar]
- Thompson, S., Parker, J. E., Marchal, J., et al. 2011, J. Synchrotron Radiation, 18, 637 [Google Scholar]
- Uchida, T., Takeya, S., Wilson, L. D., et al. 2003, Can. J. Phys., 81, 351 [NASA ADS] [CrossRef] [Google Scholar]
- Udachin, K. A., Ratcliffe, C. I., & Ripmeester, J. A. 2001, J. Phys. Chem. B, 105, 4200 [CrossRef] [Google Scholar]
- Waite, J. H., Lewis, W. S., Magee, B. A., et al. 2009, Nature, 460, 487 [NASA ADS] [CrossRef] [Google Scholar]
- Windisch, C. F., Glezakou, V.-A., Martin, P. F., et al. 2012, Phys. Chem. Chem. Phys., 14, 2560 [CrossRef] [Google Scholar]
All Figures
|
Fig. 1 a) High-pressure cell used to produce clathrates by injecting gas into ice formed by the in situ freezing of water. b) Experimental arrangement for collecting in situ, variable temperature SXPD and Raman spectroscopic data on clathrate hydrates. |
| In the text | |
|
Fig. 2 X-ray powder diffraction patterns for ice at 200 K in air at ambient pressure (bottom), ice and CO2 clathrate mixture at 220 K and CO2 pressure 20.42 bar (middle) and pure CO2 clathrate at 253 K and CO2 pressure 20.42 bar (top). The strong reflection at ~20° 2θ due to the sapphire capillary has been removed from the data. |
| In the text | |
|
Fig. 3 Rietveld refinement produces a good fit to the experimental data. The experimental data are shown in blue, the calculated fit in red and the residuals in grey below. The strong reflection between 19−21° 2θ, due to the sapphire capillary, has been excluded from the refinement. |
| In the text | |
|
Fig. 4 Top left: Raman spectrum of CO2 clathrate hydrate at 260 K. Main feature at ~3200 cm-1 is due to O−H stretch. Boxed regions are expanded in adjacent plots. Top right: close-up of main Raman spectrum in the range 1200−1500 cm-1, showing ~1280 cm-1 and ~1390 cm-1 features. Bottom left: close-up in the range 50−350 cm-1, showing ~220 cm-1 feature. Bottom right: close-up in the range 1600−5500 cm-1, showing ~1753 cm-1 and ~2341 cm-1 features. See text for details. |
| In the text | |
|
Fig. 5 Raman spectrum of a) ice at 10 bar CO2 pressure and temperature 225 K; b) ice plus clathrate at 10 bar CO2 pressure and temperatue 265 K; c) CO2 clathrate hydrate at 260 K. All in the region of the 220 cm-1 O−O feature. |
| In the text | |
|
Fig. 6 Effect of thermal cycling on the intensity of the 320 clathrate peak, seen at 14.3° in Fig. 2. Cycle 1: 200−245 K. Cycle 2: 210−230 K. Cycle 3: 220−240 K. Cycle 4: 220−250 K. |
| In the text | |
|
Fig. 7 Pressure-dependence of CO2 clathrate hydrate. As in Fig. 2 a strong feature at ~20° 2θ due to the sapphire capillary has been removed. |
| In the text | |
Current usage metrics show cumulative count of Article Views (full-text article views including HTML views, PDF and ePub downloads, according to the available data) and Abstracts Views on Vision4Press platform.
Data correspond to usage on the plateform after 2015. The current usage metrics is available 48-96 hours after online publication and is updated daily on week days.
Initial download of the metrics may take a while.