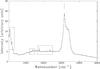
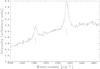
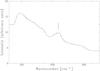
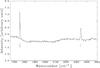
Fig. 4

Top left: Raman spectrum of CO2 clathrate hydrate at 260 K. Main feature at ~3200 cm-1 is due to O−H stretch. Boxed regions are expanded in adjacent plots. Top right: close-up of main Raman spectrum in the range 1200−1500 cm-1, showing ~1280 cm-1 and ~1390 cm-1 features. Bottom left: close-up in the range 50−350 cm-1, showing ~220 cm-1 feature. Bottom right: close-up in the range 1600−5500 cm-1, showing ~1753 cm-1 and ~2341 cm-1 features. See text for details.
Current usage metrics show cumulative count of Article Views (full-text article views including HTML views, PDF and ePub downloads, according to the available data) and Abstracts Views on Vision4Press platform.
Data correspond to usage on the plateform after 2015. The current usage metrics is available 48-96 hours after online publication and is updated daily on week days.
Initial download of the metrics may take a while.