Free Access
Fig. 7
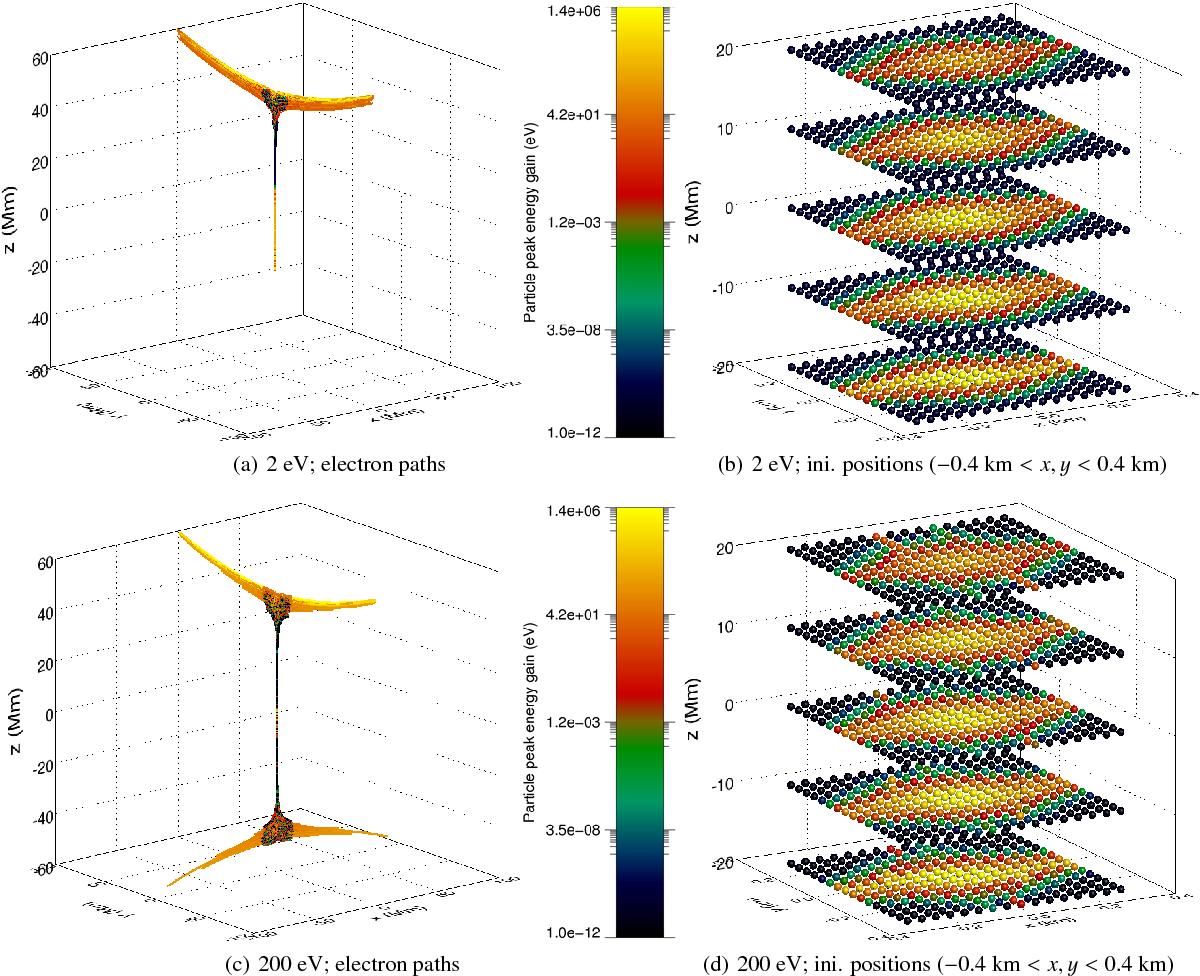
a = 10-6z0; electron trajectories a) and initial positions b) for 2 eV particles with initial pitch angle 45°. c) and d) are the same, but for 200 eV particles. The colour of each particle or track identifies the peak kinetic energy gain of the particle during the simulation (see colour bar).
Current usage metrics show cumulative count of Article Views (full-text article views including HTML views, PDF and ePub downloads, according to the available data) and Abstracts Views on Vision4Press platform.
Data correspond to usage on the plateform after 2015. The current usage metrics is available 48-96 hours after online publication and is updated daily on week days.
Initial download of the metrics may take a while.