Fig. 6
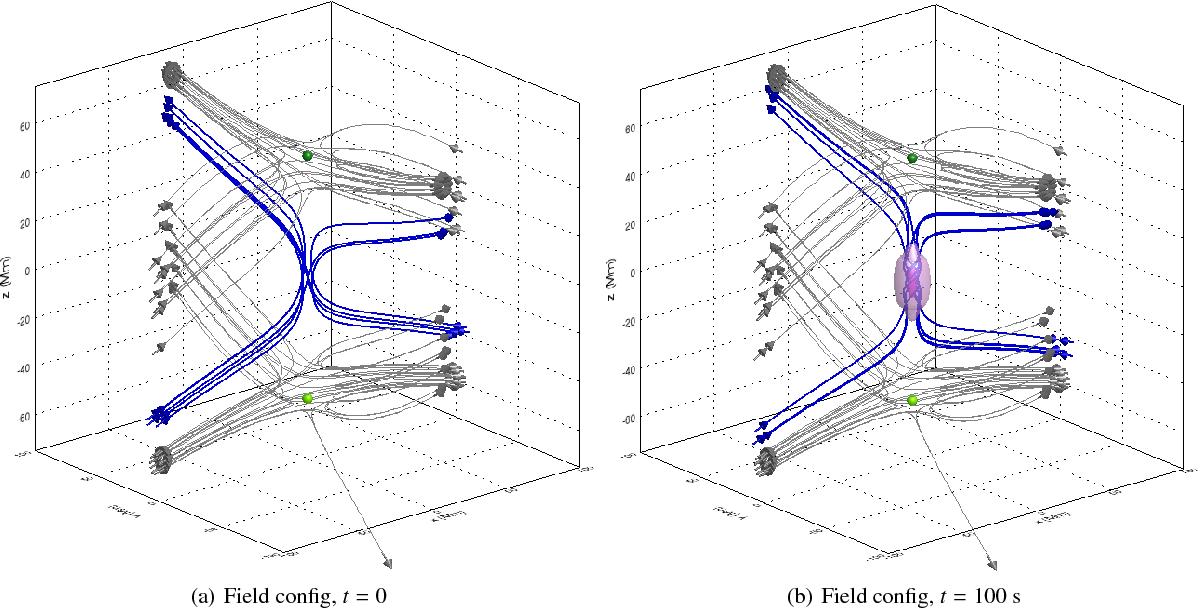
Illustration of twisting magnetic field, for specific field lines given by Eqs. (1)−(4), at a) t = 0 and b) t = 100 s. While the grey field lines illustrate the field lines originating near the spines of either null (green orbs), the blue field lines highlight field lines close to the separator and the pink isosurfaces highlight regions of parallel current, | j|| | above approximately 10% and 50% of the peak value. In these examples a = 0.1z0, to enhance visibility of the twisting of (blue) field lines around the separator.
Current usage metrics show cumulative count of Article Views (full-text article views including HTML views, PDF and ePub downloads, according to the available data) and Abstracts Views on Vision4Press platform.
Data correspond to usage on the plateform after 2015. The current usage metrics is available 48-96 hours after online publication and is updated daily on week days.
Initial download of the metrics may take a while.