Fig. 5
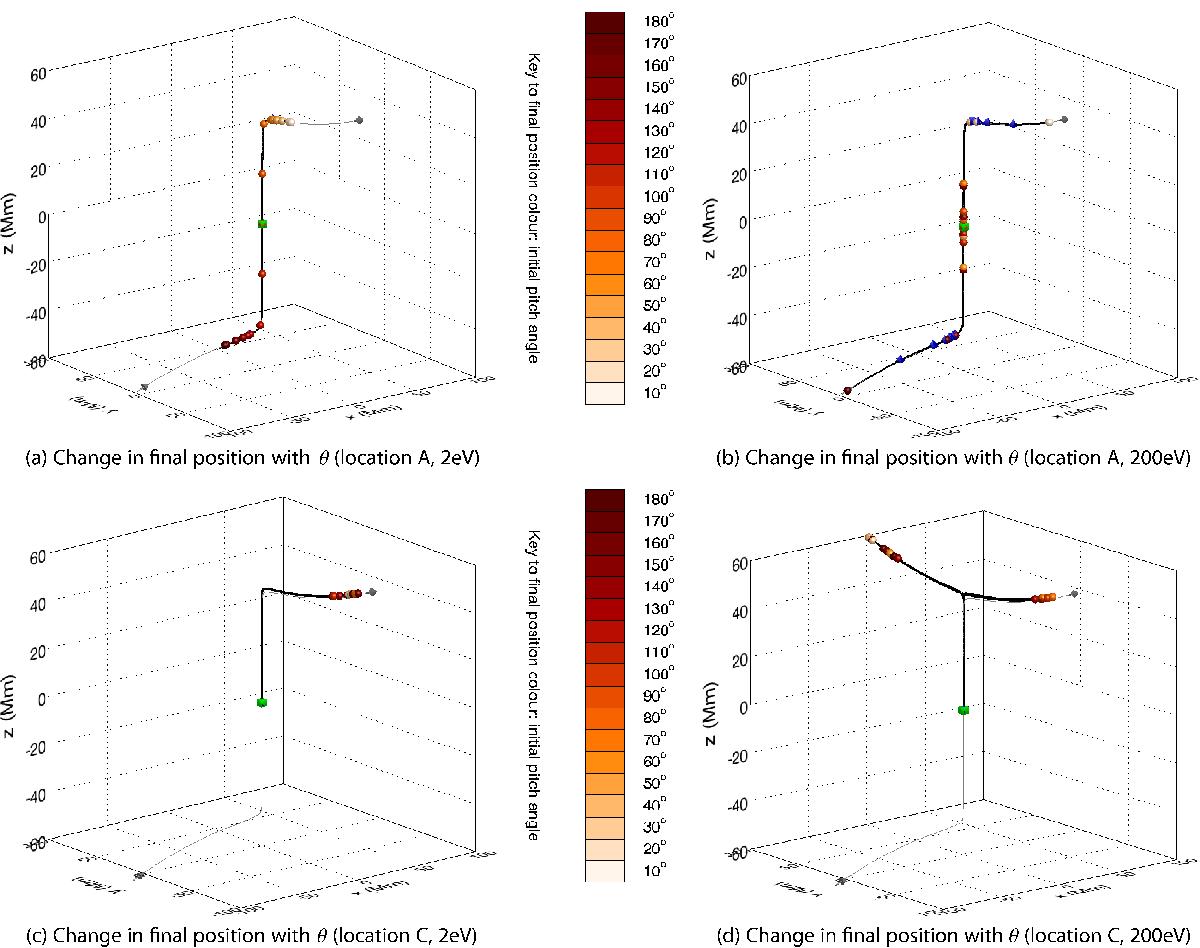
Investigation into effect of pitch angle and initial energy. a) Variation of the particle trajectories at position A (specifically their final positions) with initial pitch angle at an energy of 2 eV. b) The same result for initial energies of 200 eV. c) and d) Trajectories and end-point locations for particles beginning at position C (see Table 1). In all cases the final positions are colour-coded, depending on initial pitch angle (for key, see colour bar).
Current usage metrics show cumulative count of Article Views (full-text article views including HTML views, PDF and ePub downloads, according to the available data) and Abstracts Views on Vision4Press platform.
Data correspond to usage on the plateform after 2015. The current usage metrics is available 48-96 hours after online publication and is updated daily on week days.
Initial download of the metrics may take a while.