Fig. 9
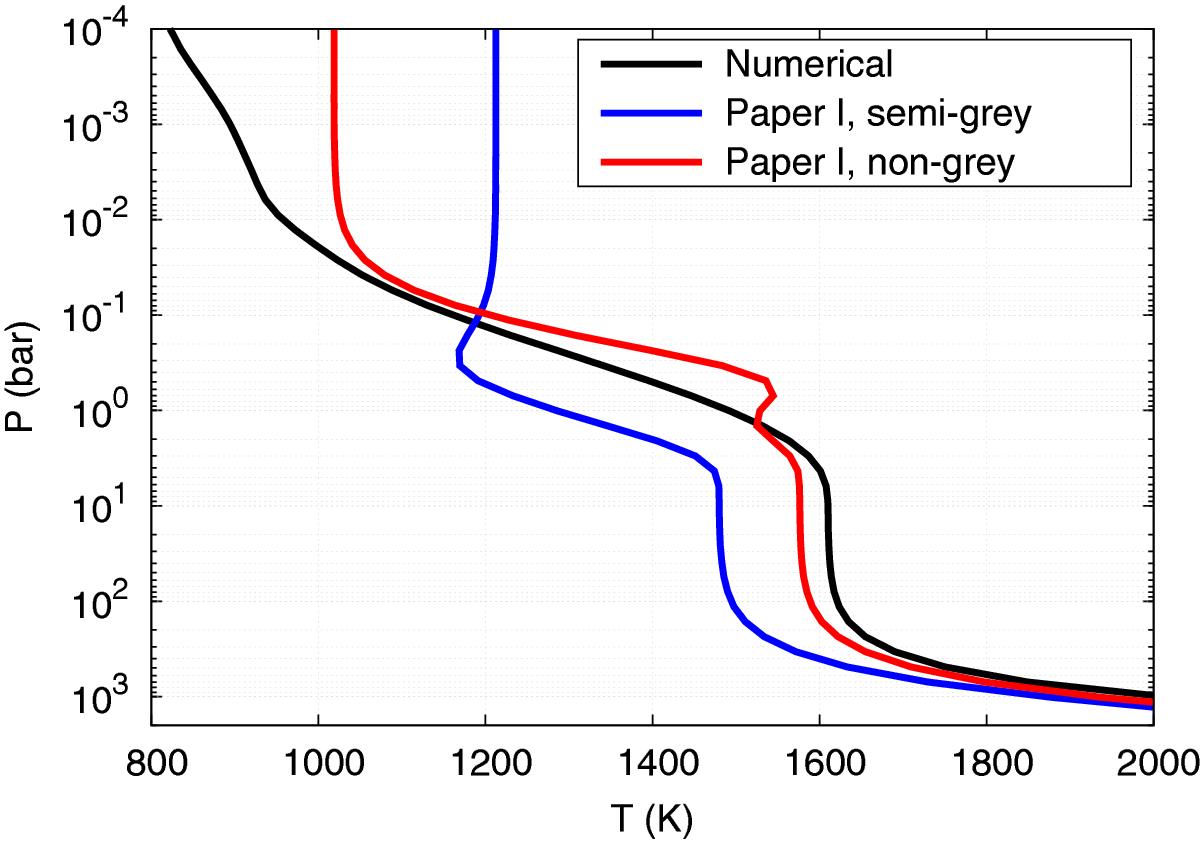
Pressure-temperature profiles calculated using the numerical model and the full
set of opacities (black), the semi-grey (blue) and the non-grey (red) analytical
models. As un Fig. 1, g = 25
m/s2, ![]() , Tint = 100 K and Tμ∗ = 1253
K. The coefficients used for the analytical models are taken
from Table 1 with γp = 1
for the semi-grey case. The non-grey model is a much better match to the numerical
profile than the semi-grey one.
, Tint = 100 K and Tμ∗ = 1253
K. The coefficients used for the analytical models are taken
from Table 1 with γp = 1
for the semi-grey case. The non-grey model is a much better match to the numerical
profile than the semi-grey one.
Current usage metrics show cumulative count of Article Views (full-text article views including HTML views, PDF and ePub downloads, according to the available data) and Abstracts Views on Vision4Press platform.
Data correspond to usage on the plateform after 2015. The current usage metrics is available 48-96 hours after online publication and is updated daily on week days.
Initial download of the metrics may take a while.