Fig. A.2
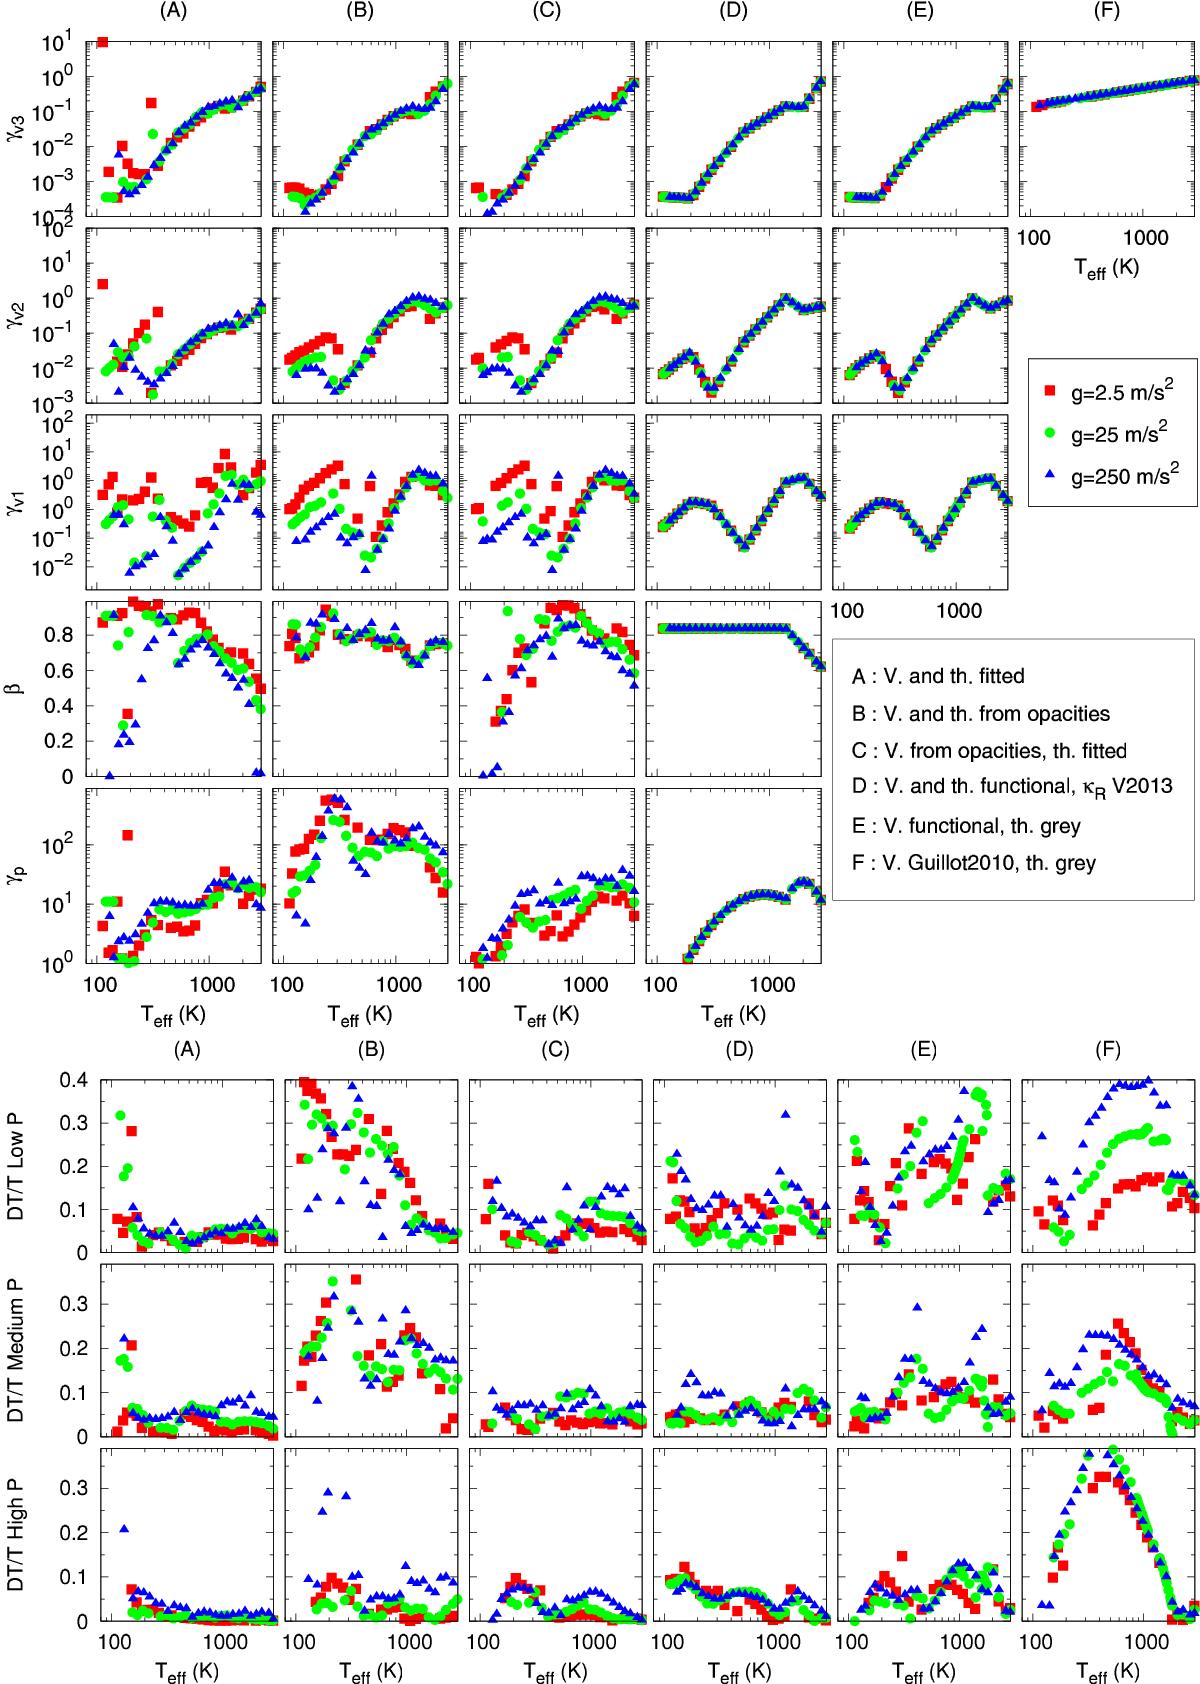
Top panel: coefficients obtained for the six different models described in Sect. 5.2 as a function of the irradiation temperature for planets with different gravities and an internal temperature of 100 K. TiO and VO have been artificially removed from the atmosphere. Bottom panel: mean relative difference between the numerical and the analytical model for the six different models described in Sect. 5.2. The first line is the mean difference for 10-4bar <P< 10-2bar, the second line for 10-2bar <P< 100bar and the third line for 100bar <P< 102bar. In terms of Rosseland optical depth, the low pressure zone corresponds to the optically thin part of the atmosphere with 10-8 (25 ms-2/ g) ≲ τR ≲ 10-2 (25 ms-2/ g). The medium pressure zone corresponds to the transition from optically thin to optically thick with 10-4 (25 ms-2/ g) ≲ τR ≲ 10 (25 ms-2/ g). The high pressure zone corresponds to the optically thick part of the atmosphere with (25 ms-2/ g) ≲ τR ≲ 104 (25 ms-2/ g).
Current usage metrics show cumulative count of Article Views (full-text article views including HTML views, PDF and ePub downloads, according to the available data) and Abstracts Views on Vision4Press platform.
Data correspond to usage on the plateform after 2015. The current usage metrics is available 48-96 hours after online publication and is updated daily on week days.
Initial download of the metrics may take a while.