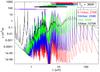
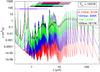
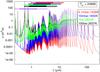
Fig. A.1
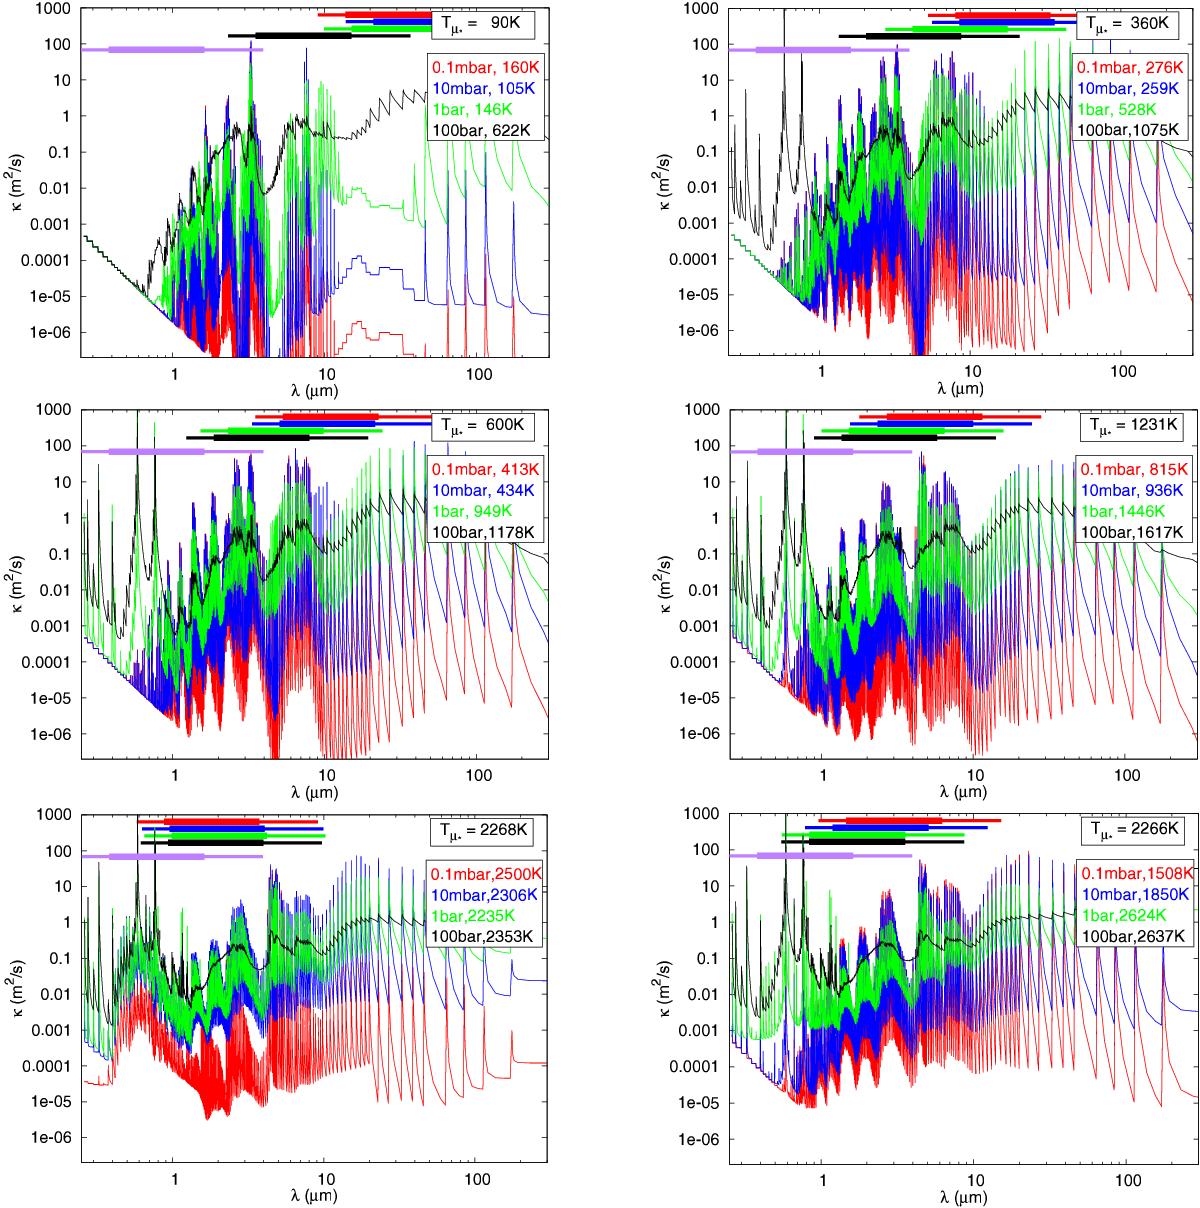
Opacities from Freedman et al. (2008) organized as k-coefficient inside each bin of wavelength atmospheres with different irradiation. The first five panels are for solar-composition atmospheres whereas the bottom right panel is for an atmospheres depleted in TiO/VO. The different colors are for different temperature and pressure taken along the corresponding numerical P-T profile. The thick bars on top represents the wavelength range where 90% of the thermal flux is emitted, the thin bars where 99% of the thermal flux is emitted. We used Tint = 100K, ![]() and g = 25m/s2.
and g = 25m/s2.
Current usage metrics show cumulative count of Article Views (full-text article views including HTML views, PDF and ePub downloads, according to the available data) and Abstracts Views on Vision4Press platform.
Data correspond to usage on the plateform after 2015. The current usage metrics is available 48-96 hours after online publication and is updated daily on week days.
Initial download of the metrics may take a while.