Fig. 1
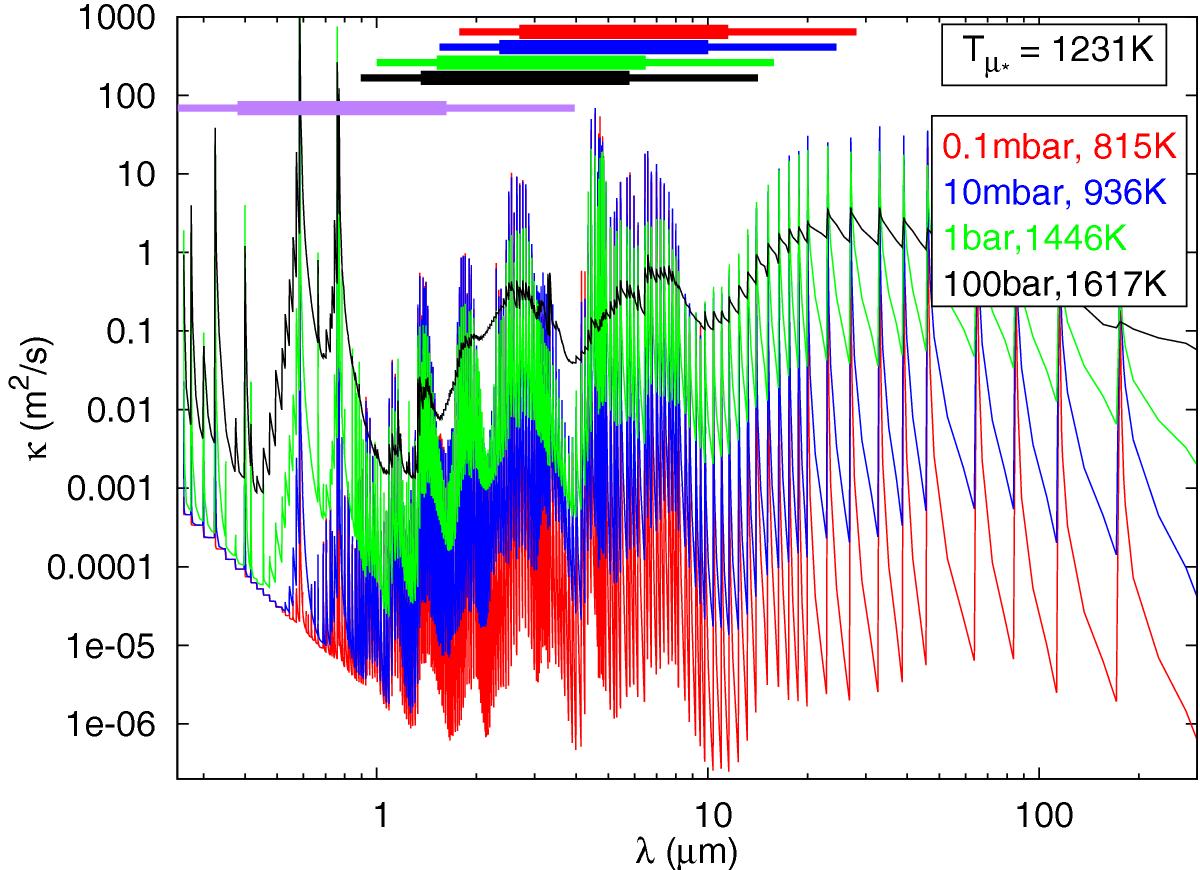
Line-by-line opacities as a function of wavelength for five different conditions
corresponding to different points in the PT profile of a giant planet with
g = 25
m/s2, ![]() , Tint = 100 K and Tμ∗ = 1231
K, corresponding to the dayside average profile of a planet
orbiting at 0.053 AU
from a sun-like star. Inside each bin of frequency, we plot the cumulative
distribution function of the opacities instead of the line-by-line opacity function.
The purple bar represents the wavelength range where 90% (thick line) and 99% (thin line) of the stellar energy
is emitted. The other horizontal bars represents the wavelength range of the thermal
emission of the planet at different locations along the PT profile.
, Tint = 100 K and Tμ∗ = 1231
K, corresponding to the dayside average profile of a planet
orbiting at 0.053 AU
from a sun-like star. Inside each bin of frequency, we plot the cumulative
distribution function of the opacities instead of the line-by-line opacity function.
The purple bar represents the wavelength range where 90% (thick line) and 99% (thin line) of the stellar energy
is emitted. The other horizontal bars represents the wavelength range of the thermal
emission of the planet at different locations along the PT profile.
Current usage metrics show cumulative count of Article Views (full-text article views including HTML views, PDF and ePub downloads, according to the available data) and Abstracts Views on Vision4Press platform.
Data correspond to usage on the plateform after 2015. The current usage metrics is available 48-96 hours after online publication and is updated daily on week days.
Initial download of the metrics may take a while.