Fig. 4
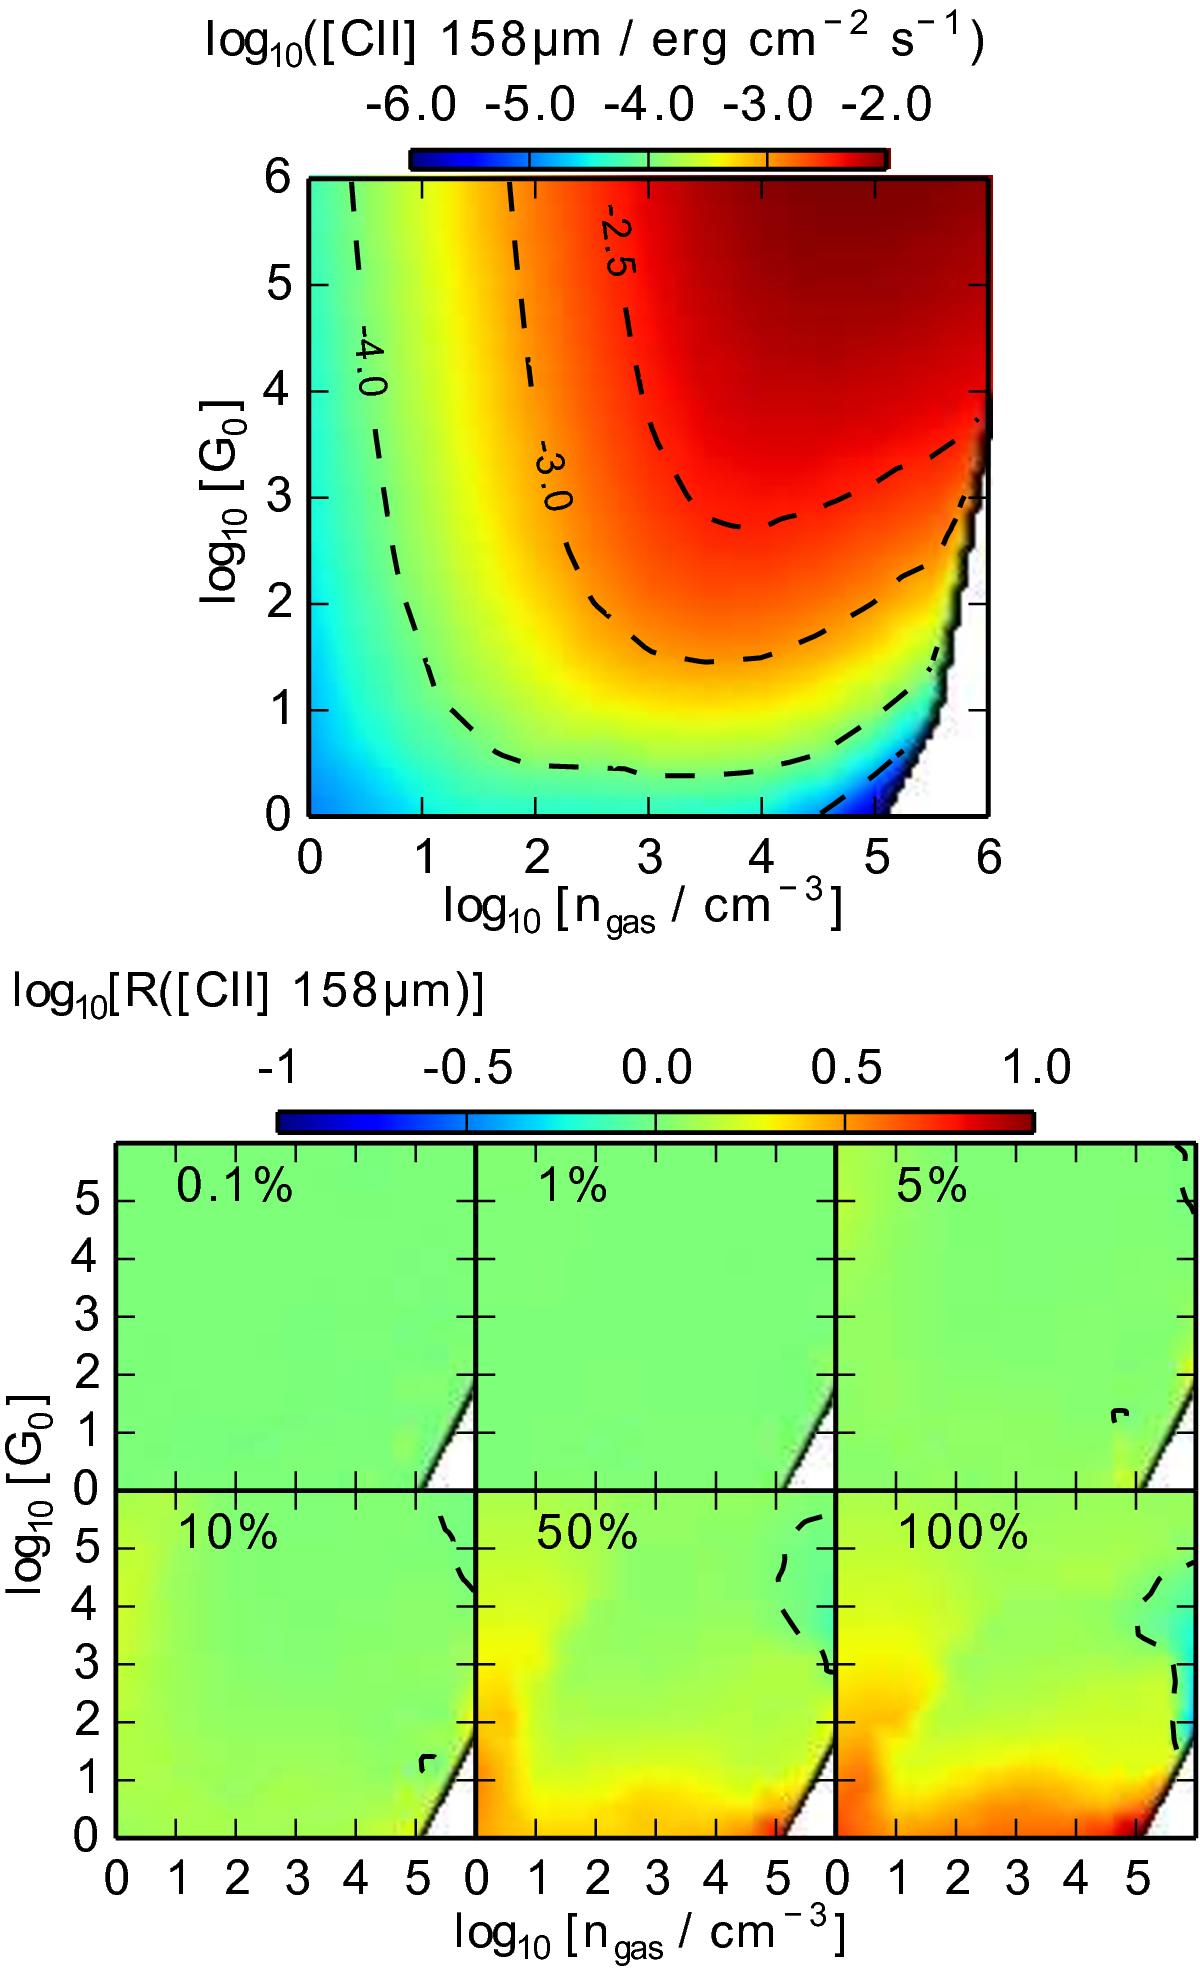
Top: reference grid for the [CII] 158 μm line emission for PDRs without mechanical heating. Bottom: [CII] 158 μm line emission corresponding to different value of α labelled at the top of each panel. Each model in the grid has an additional amount of heating introduced to its energy budget. The added Γmech is in terms of a percentage of the surface heating (as explained in the methods section). Each grid shows the percentage change (increase or decrease) in emission relative to that in the reference grid in the top panel. For instance, when Γmech = 0.5 Γsurf (α = 0.5) (panel with the 50% label), the emission in MA1 is enhanced by a factor of ~3. A decrease in emission is observed only when Γmech> 0.5Γsurf to the right of the contour line at M4. We define the relative change as R = I(α) /I(α = 0), where I(α) is the emission intensity of the line at a specific value of α. Here and in all such subsequent plots the dashed contour line traces R = 1. On this line the emission with and without extra heating are the same. In other words, models on this line experience no change in the emission because of Γmech. In general “redder” regions correspond to enhanced emission, whereas “bluer” regions indicated regions where emission are suppressed.
Current usage metrics show cumulative count of Article Views (full-text article views including HTML views, PDF and ePub downloads, according to the available data) and Abstracts Views on Vision4Press platform.
Data correspond to usage on the plateform after 2015. The current usage metrics is available 48-96 hours after online publication and is updated daily on week days.
Initial download of the metrics may take a while.