Fig. 3
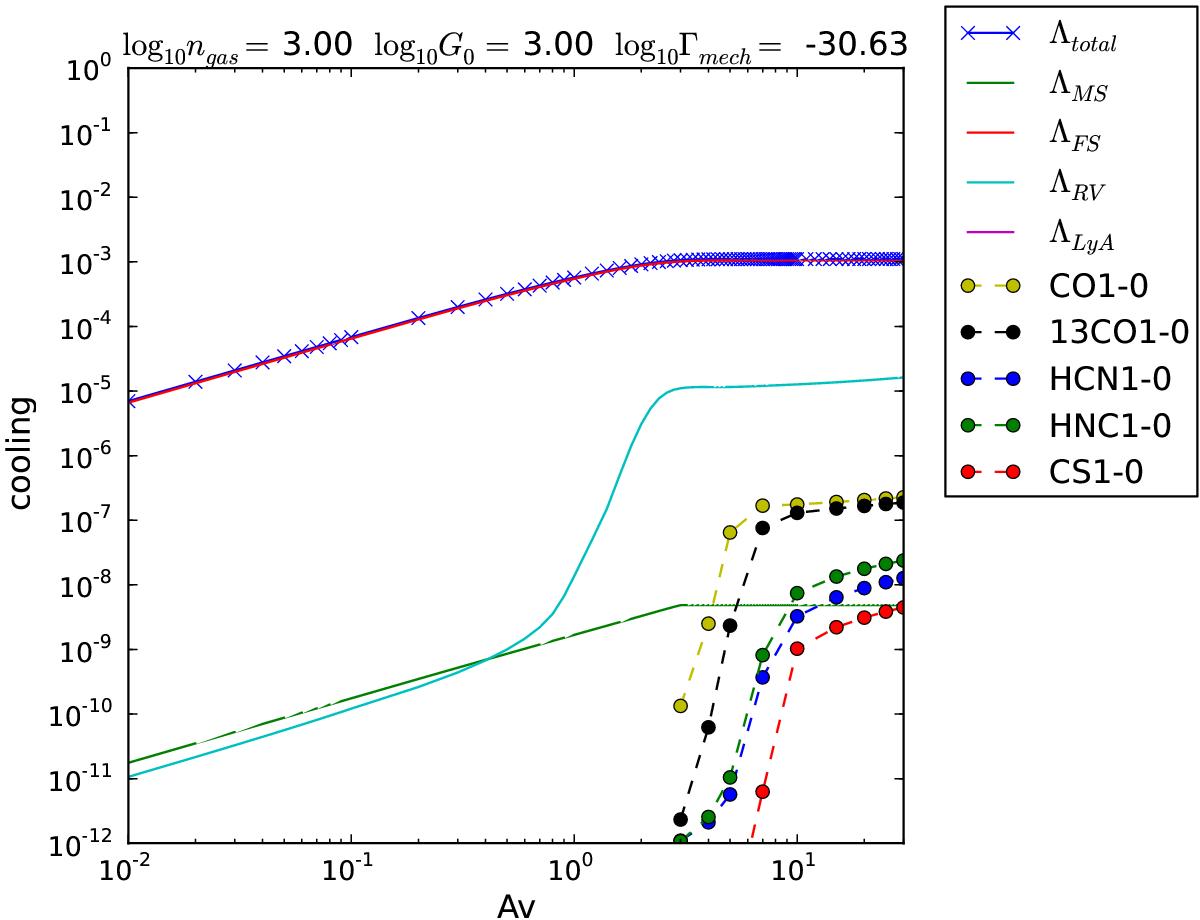
Integrated cooling rates (in erg cm-2 s-1) ![]() as a function of AV for the various cooling mechanisms included in the PDR code. The curves for the total cooling (blue with crosses) and the FS cooling curve overlap. The remaining solid curves (MS for meta-stable line cooling, RV for ro-vibrational cooling of H2, and LyA for the Lyman-alpha cooling) are shown for completeness. The dotted curves (with filled circles) are the first rotational transitions for the molecular species computed using LVG models.
as a function of AV for the various cooling mechanisms included in the PDR code. The curves for the total cooling (blue with crosses) and the FS cooling curve overlap. The remaining solid curves (MS for meta-stable line cooling, RV for ro-vibrational cooling of H2, and LyA for the Lyman-alpha cooling) are shown for completeness. The dotted curves (with filled circles) are the first rotational transitions for the molecular species computed using LVG models.
Current usage metrics show cumulative count of Article Views (full-text article views including HTML views, PDF and ePub downloads, according to the available data) and Abstracts Views on Vision4Press platform.
Data correspond to usage on the plateform after 2015. The current usage metrics is available 48-96 hours after online publication and is updated daily on week days.
Initial download of the metrics may take a while.