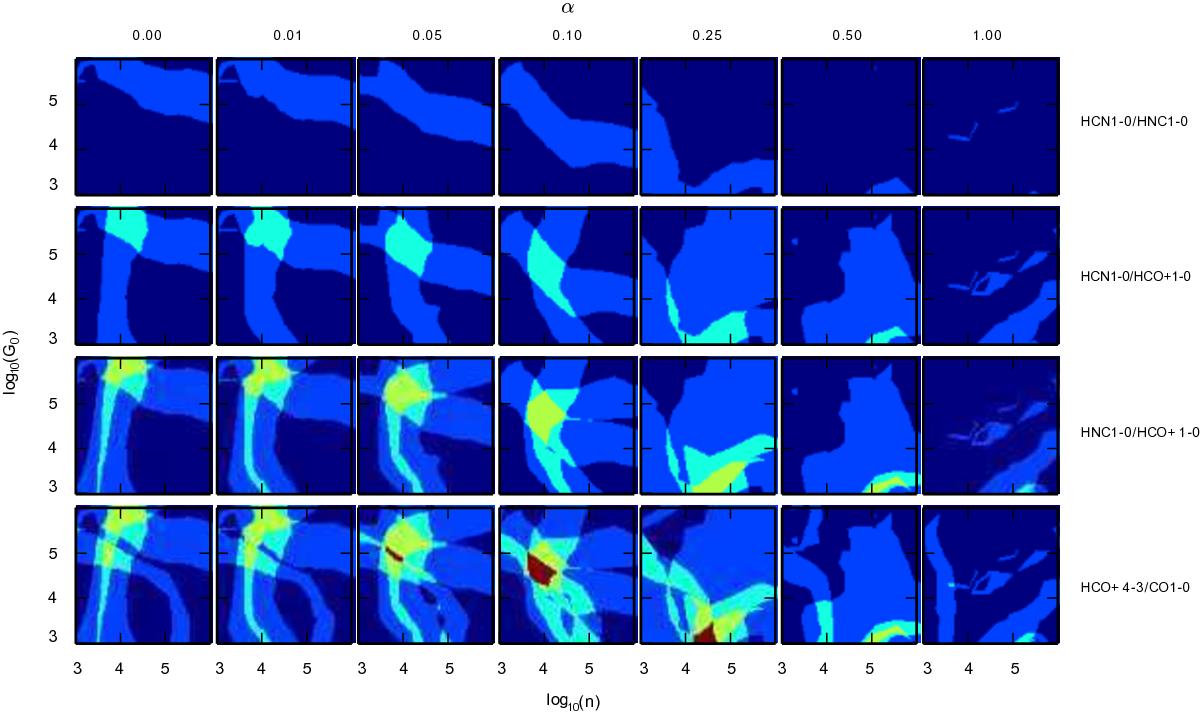
Fig. 16

Constraining the Γmech, AV, n and G0 for starburst galaxies. In this figure we illustrate the procedure used to constrain those parameters for AV = 5 mag, the figures for the remaining AV are in Figs. C.7 and C.8. Each row corresponds to a certain line ratio, and each column corresponds to a certain α. The colours correspond to regions where the observed line ratio in each grid is within the observed range of Table 4. In the first row regions where HCN(1–0)/HNC(1–0) is between 1.5 and 4.0 is shaded in light blue. In the second row we include HCN(1–0)/HCO+(1–0). The regions which are within the observed line ratios for both HCN(1–0)/HCO+(1–0) and HCN(1–0)/HNC(1–0) are shaded in cyan. In the third row, we introduce HNC(1–0)/HCO+(1–0), the region satisfying all three line ratios is shaded in green. We notice that green regions exist for all values of α in the third row. Hence we can not constrain α so far. It is only when HCO+(4-3)/CO(1–0) is included, α is constrained to 0.1 (red region in the α = 0.1 column) in the last row. Although much smaller red regions are also visible for α = 0.05 and α = 0.25, the global minimum would be most likely around α = 0.1 region. In applying a similar procedure to grids corresponding to AV = 10 and 30 mag, we do not observe any red region.
Current usage metrics show cumulative count of Article Views (full-text article views including HTML views, PDF and ePub downloads, according to the available data) and Abstracts Views on Vision4Press platform.
Data correspond to usage on the plateform after 2015. The current usage metrics is available 48-96 hours after online publication and is updated daily on week days.
Initial download of the metrics may take a while.


