Fig. 6
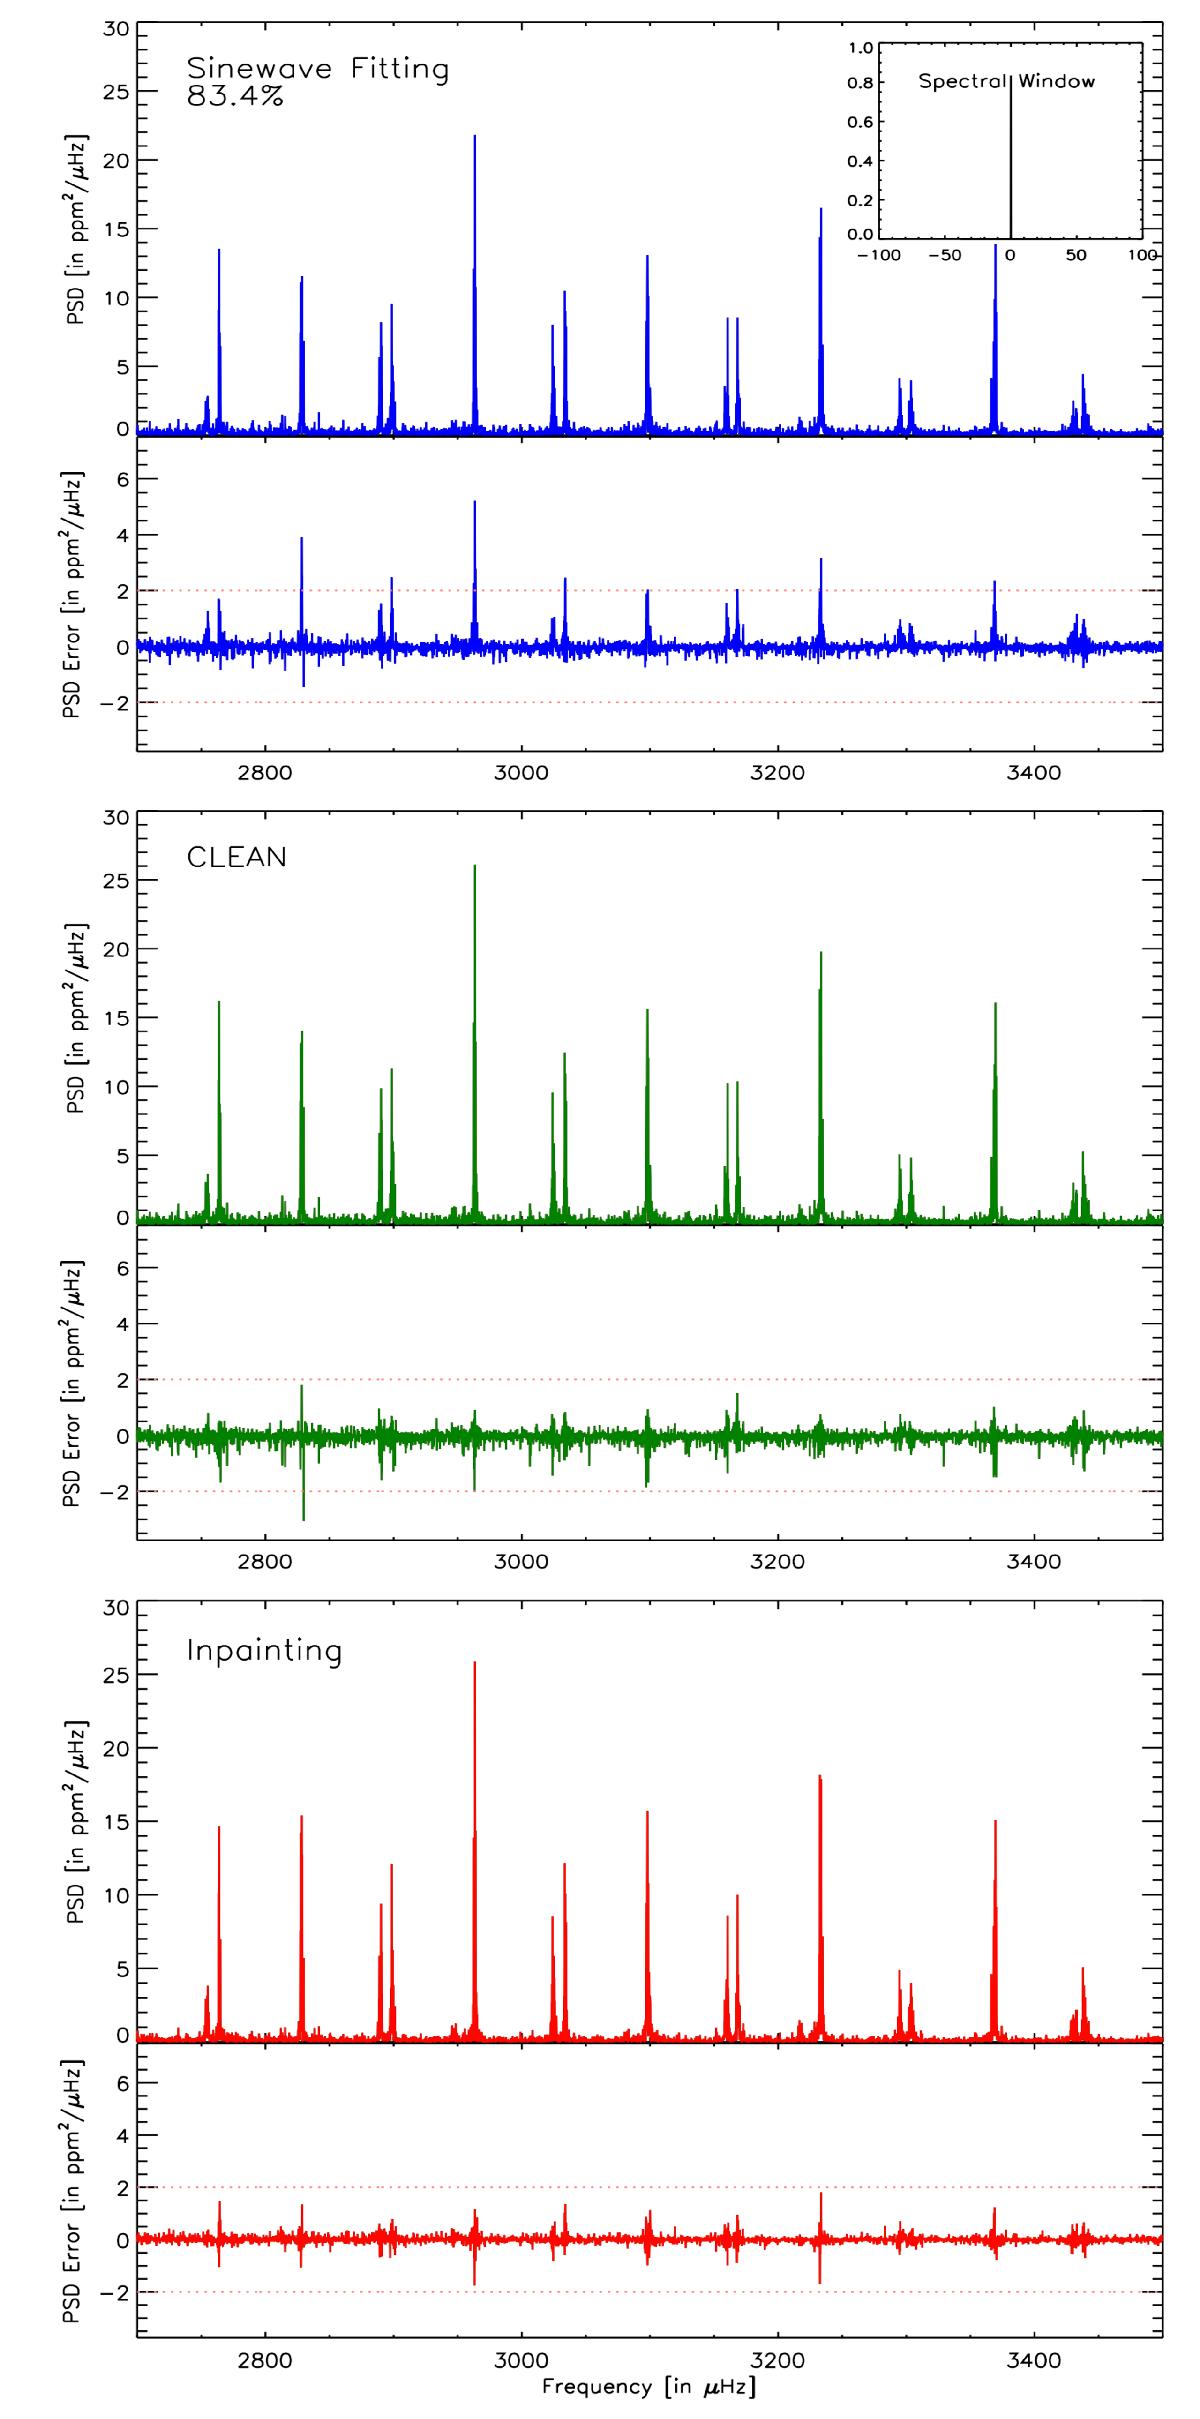
Power density spectrum and errors (in units of ppm2/μHz) estimated from a time series of 91.2 days masked with a mask of CoRoT corresponding to a duty cycle of 83.4%. The PDS is computed with a least-squares sinewave fit on the incomplete time series (top panel), using an FFT on the CLEANed time series (middle panel) and an FFT on the inpainted time series (bottom panel).
Current usage metrics show cumulative count of Article Views (full-text article views including HTML views, PDF and ePub downloads, according to the available data) and Abstracts Views on Vision4Press platform.
Data correspond to usage on the plateform after 2015. The current usage metrics is available 48-96 hours after online publication and is updated daily on week days.
Initial download of the metrics may take a while.