Free Access
Fig. 2
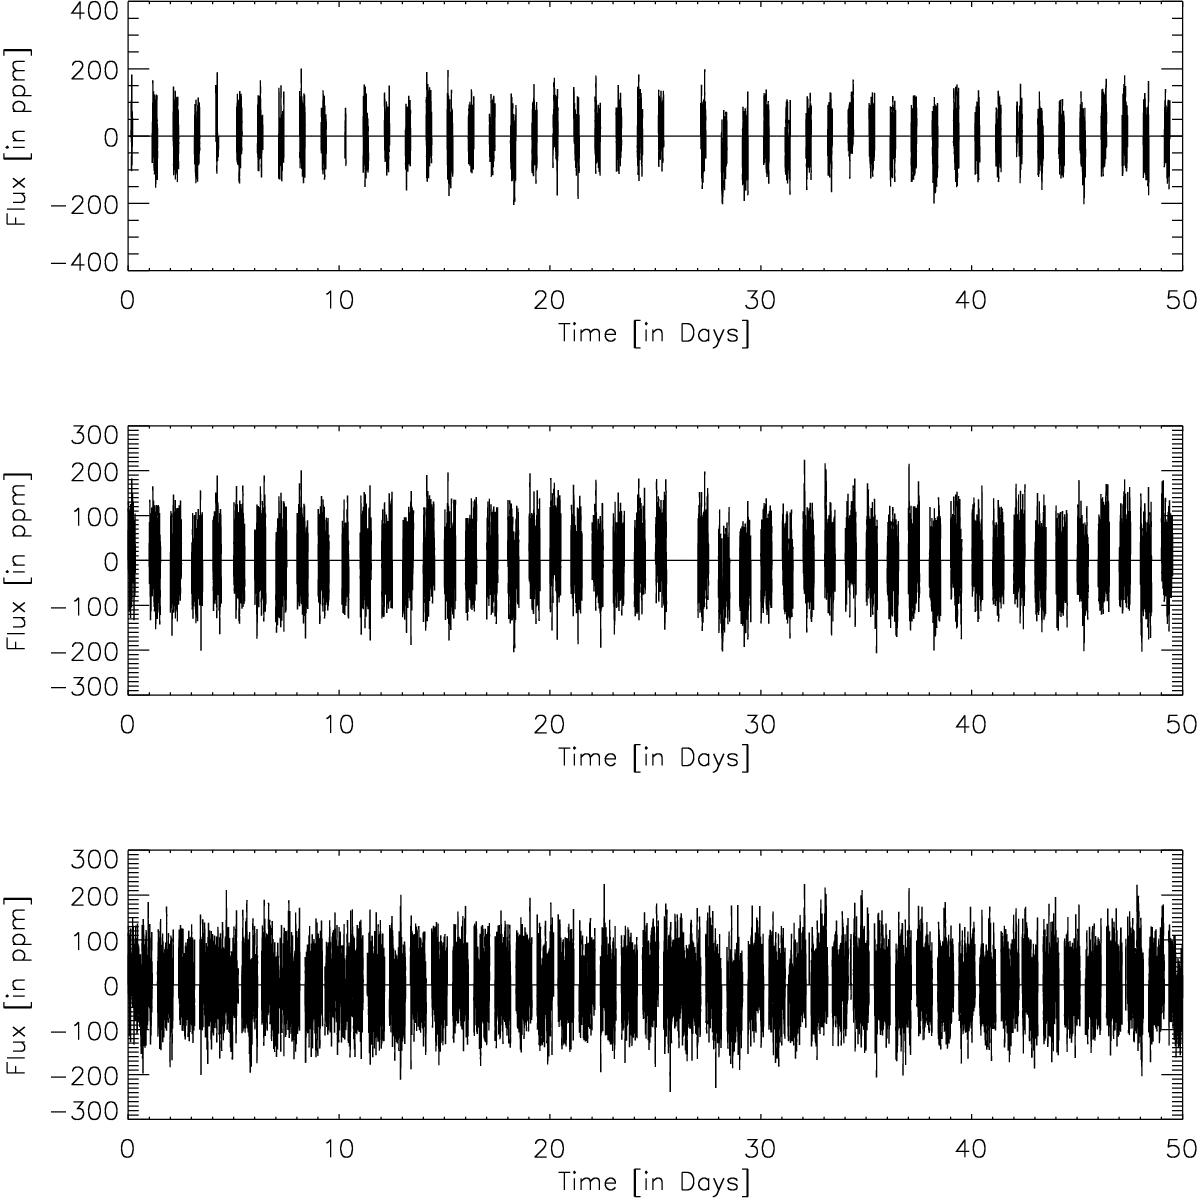
Sample of 50 days of the original VIRGO/SPM data multiplied by a MARK-I like mask to simulate ground-based observations from a single site corresponding to a duty cycle of 23% (top panel), two different sites with a duty cycle of 50% (middle panel), and multiple sites corresponding to a duty cycle of 77% (bottom panel).
This figure is made of several images, please see below:
Current usage metrics show cumulative count of Article Views (full-text article views including HTML views, PDF and ePub downloads, according to the available data) and Abstracts Views on Vision4Press platform.
Data correspond to usage on the plateform after 2015. The current usage metrics is available 48-96 hours after online publication and is updated daily on week days.
Initial download of the metrics may take a while.