Fig. 3
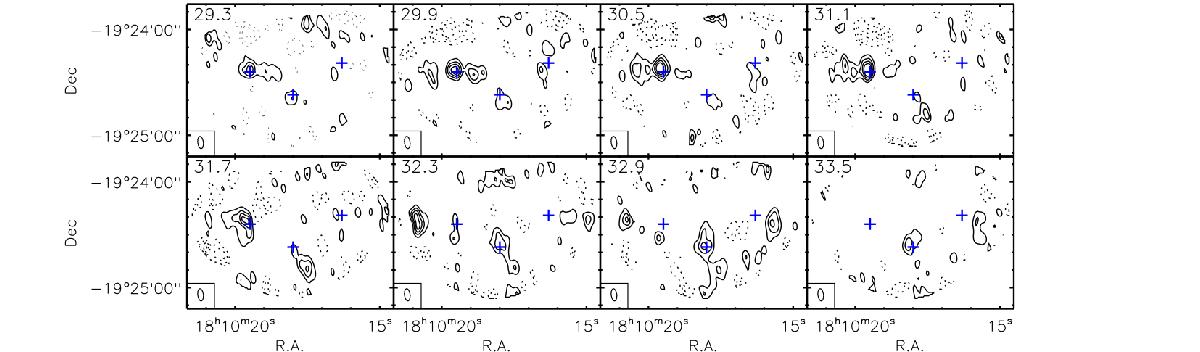
Channel map of merged N2H+ emission. Contours are plotted at −50 (dotted), 50, 100, 150, and 200 mJy beam-1. The velocity channel is indicated in the upper-left of each panel in units of km s-1, and the blue plus signs indicate the centres of the main regions. The synthesised beam in shown in the lower-left corner of each panel.
Current usage metrics show cumulative count of Article Views (full-text article views including HTML views, PDF and ePub downloads, according to the available data) and Abstracts Views on Vision4Press platform.
Data correspond to usage on the plateform after 2015. The current usage metrics is available 48-96 hours after online publication and is updated daily on week days.
Initial download of the metrics may take a while.