Fig. 1
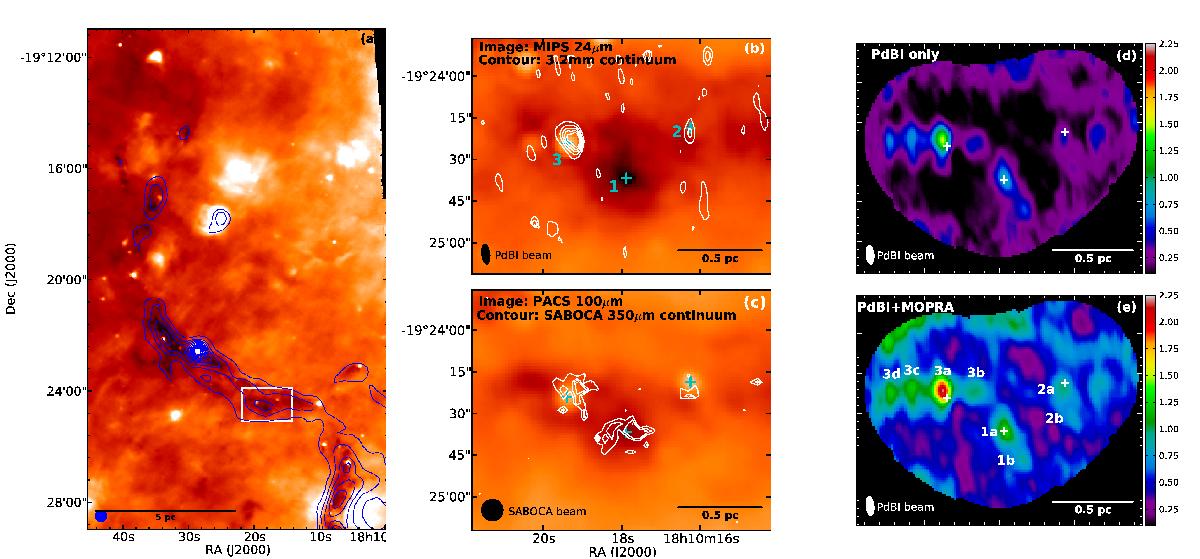
a) Full G11 filament seen at 70 μm with Herschel/PACS with SPIRE 350 μm contours over-plotted from 9 Jy beam-1 increasing in steps of 3 Jy beam-1 (adapted from Henning et al. 2010). The SPIRE 350 μm beam (FWHM) is shown in the lower-left corner. The white rectangle marks the area shown in the rest of the panels. b) MIPS 24 μm image with 3.2 mm continuum contours from a PdBI-only map. The contour levels are from 0.2 to 0.12 mJy beam-1 in steps of 0.2 mJy beam-1. The synthesised beam is shown in the lower-left corner. c) APEX-SABOCA 350 μm continuum contours (Ragan et al. 2013) at 0.81, 1.08, 1.35 Jy beam-1 plotted over the PACS 100 μm image. The SABOCA 350 μm beam (FWHM) is shown in the lower left. d) Integrated intensity of N2H+ (1−0) from the PdBI-only map. e) Integrated intensity of the combined PdBI+MOPRA map. Both d) and e) are integrated from 29 to 33 km s-1, and the units of the colourscale are Jy beam-1km s-1. The + signs indicate the positions of the main continuum cores identified in panel b) and Table 1.
Current usage metrics show cumulative count of Article Views (full-text article views including HTML views, PDF and ePub downloads, according to the available data) and Abstracts Views on Vision4Press platform.
Data correspond to usage on the plateform after 2015. The current usage metrics is available 48-96 hours after online publication and is updated daily on week days.
Initial download of the metrics may take a while.