Fig. 3
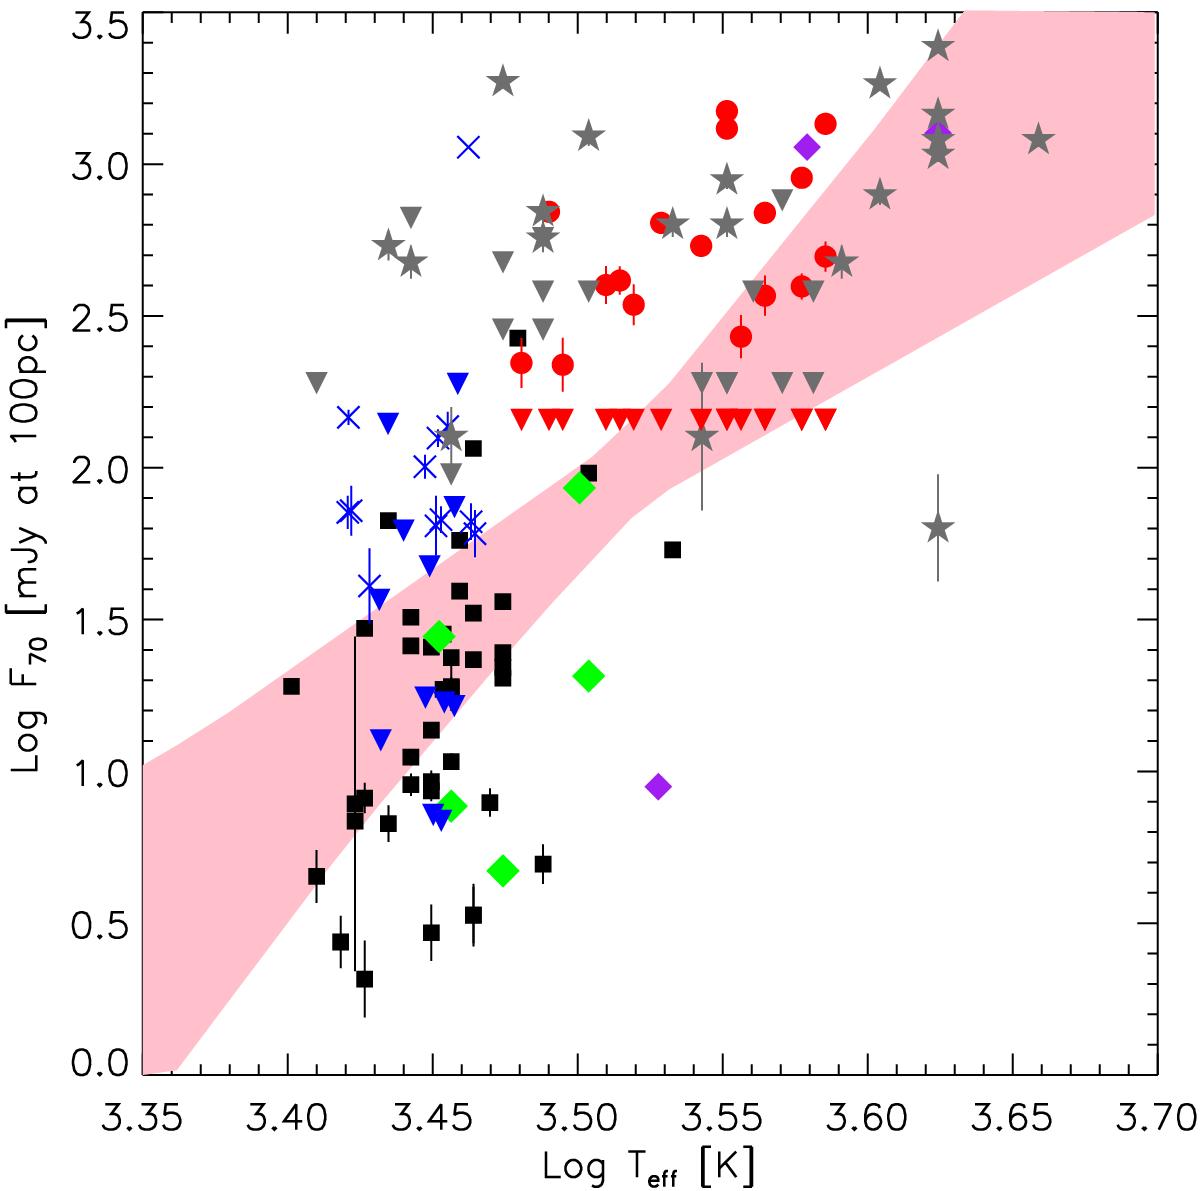
Fluxes at Herschel 70 μm (F70) as a function of the stellar temperature (Teff). Data points are collected from Harvey et al. (2012a,b) for a mix of nearby regions (black squares), Olofsson et al. (2013) for Chameleon I (red circles), Spezzi et al. (2013) for Chameleon II (gray stars), Alves de Oliveira et al. (2013) for ρ Ophiuchi (blue crosses), and from Riviere-Marichalar et al. (2013, purple diamonds) and our program (green diamonds) for the TWA. Upper limits are indicated as upside down triangles with the same color scheme. The 100 μm fluxes reported by Olofsson et al. (2013) were converted to 70 μm fluxes by multiplying them with a factor of 1.12, the median from very low-mass stars with detections at both wavelengths. The shaded region marks 95% confidence intervals on the log Teff ~ log F70 relation, derived from a Bayesian linear regression analysis that takes the errors and upper limits of measurements into account (Kelly 2007).
Current usage metrics show cumulative count of Article Views (full-text article views including HTML views, PDF and ePub downloads, according to the available data) and Abstracts Views on Vision4Press platform.
Data correspond to usage on the plateform after 2015. The current usage metrics is available 48-96 hours after online publication and is updated daily on week days.
Initial download of the metrics may take a while.