Fig. 1
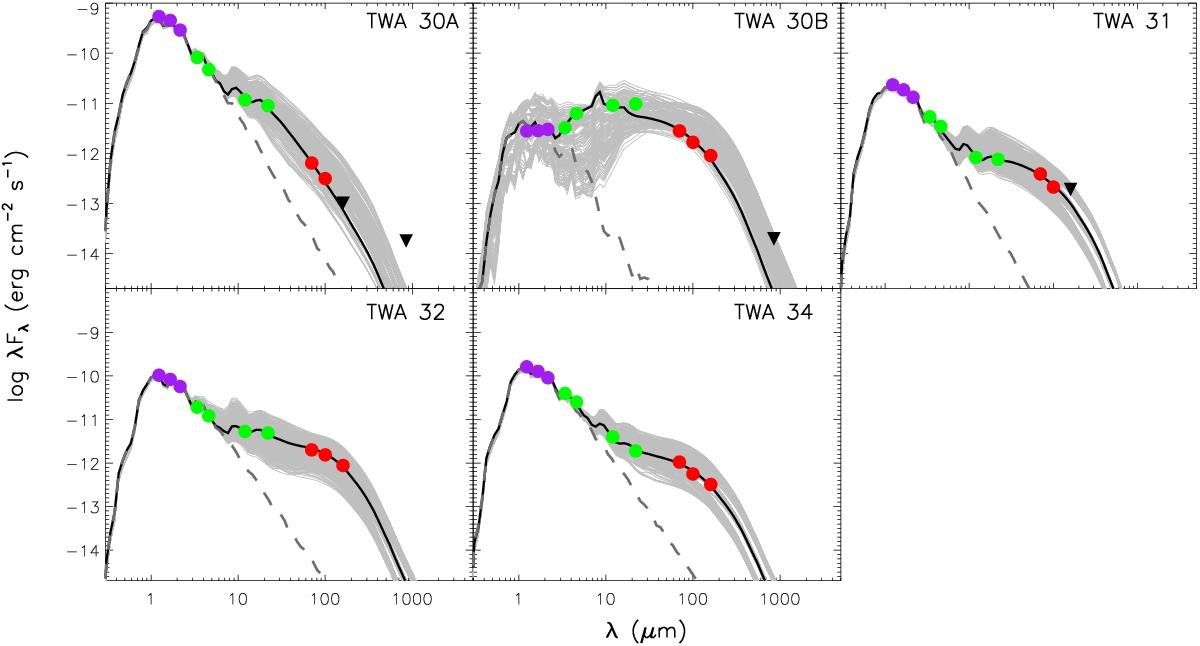
Spectral energy distributions of the brown dwarf disks. The dots depict the photometry taken with 2MASS (purple), WISE (green), and Herschel/PACS (red). The upside down triangles show the 3σ upper limits measured with PACS and SCUBA-2. The best-fit models are indicated as black solid lines, whereas the dashed lines represent the photospheric emission levels. The gray lines denote all the models that are within the uncertainties given in Table 3, showing the constraints of the best fit models for each object. To deduce the uncertainties of model parameters with Bayesian analysis, we only take the models calculated in the grid into account, see Sect. 3. Notes: (1) for the binary TWA 32, the near-IR photometry shown in this figure are F2MASS J = 42.6 mJy, F2MASS H = 46.1 mJy and F2MASS K = 41.2 mJy. These values are different from the observed ones of the whole binary system, see Sect. 2.1. (2) For TWA 30B, all the models indicated as gray lines feature i = 75°. Models with other inclinations are not shown because the derivation of uncertainties in Rin, Mdisk, β and h100 is based on models with i = 75° in the grid; see Sect. 3 for an explanation.
Current usage metrics show cumulative count of Article Views (full-text article views including HTML views, PDF and ePub downloads, according to the available data) and Abstracts Views on Vision4Press platform.
Data correspond to usage on the plateform after 2015. The current usage metrics is available 48-96 hours after online publication and is updated daily on week days.
Initial download of the metrics may take a while.