Fig. 6
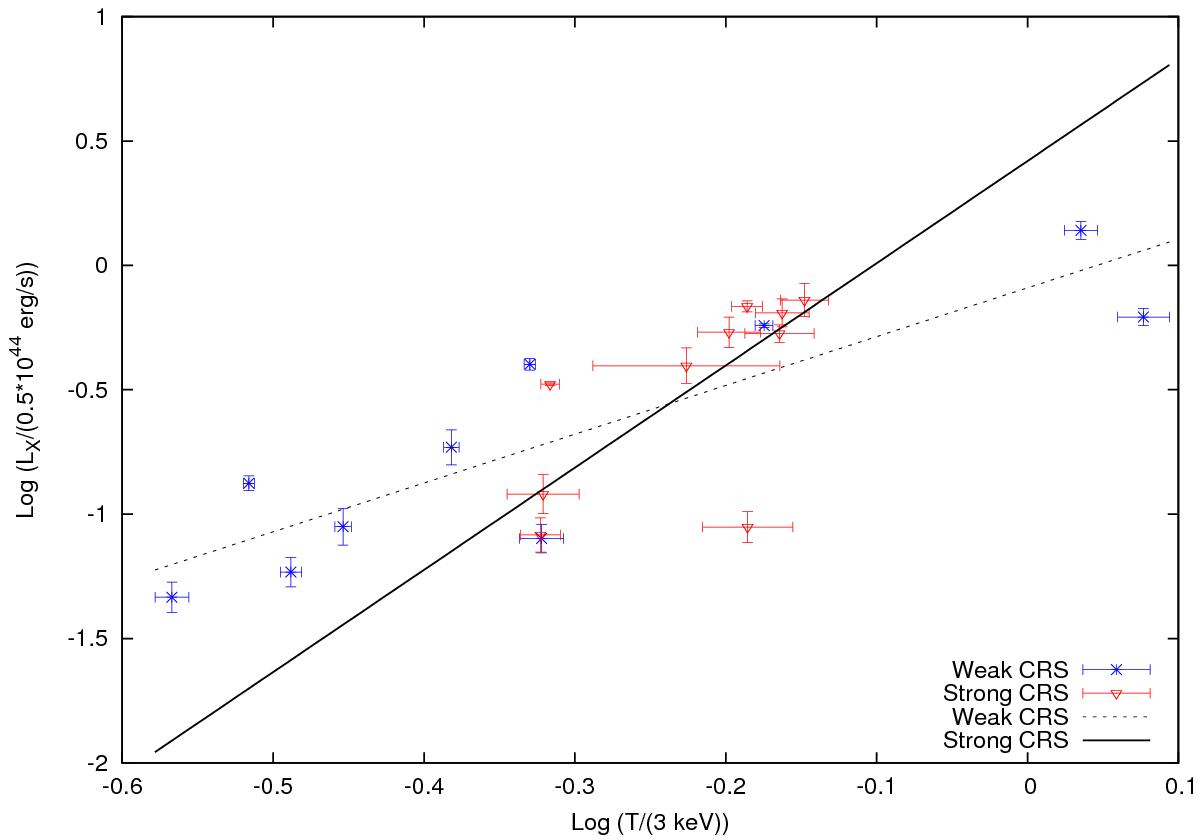
The LX − T relation for sub-samples divided on the basis of the median radio luminosity of the CRS. Blue points (“weak” CRS) represent those groups that have a CRS with total radio luminosity less than the median radio luminosity, while red points represent those groups with a CRS greater than or equal to the median radio luminosity.
Current usage metrics show cumulative count of Article Views (full-text article views including HTML views, PDF and ePub downloads, according to the available data) and Abstracts Views on Vision4Press platform.
Data correspond to usage on the plateform after 2015. The current usage metrics is available 48-96 hours after online publication and is updated daily on week days.
Initial download of the metrics may take a while.