| Issue |
A&A
Volume 573, January 2015
|
|
|---|---|---|
| Article Number | A5 | |
| Number of page(s) | 12 | |
| Section | Interstellar and circumstellar matter | |
| DOI | https://doi.org/10.1051/0004-6361/201424583 | |
| Published online | 10 December 2014 | |
The effect of external environment on the evolution of protostellar disks
1 University of Vienna, Department of Astrophysics, 1180 Vienna, Austria
e-mail: This email address is being protected from spambots. You need JavaScript enabled to view it.
2 Research Institute of Physics, Southern Federal University, Stachki Ave. 194, 344090 Rostov-on-Don, Russia
3 UCO/Lick Observatory, University of California, Santa Cruz CA 95064, USA
Received: 10 July 2014
Accepted: 29 September 2014
Abstract
Aims. Using numerical hydrodynamics simulations, we studied the gravitational collapse of prestellar cores of subsolar mass embedded into a low-density external environment.
Methods. Four models with different magnitude and direction of rotation of the external environment with respect to the central core were studied and compared with an isolated model.
Results. We found that the infall of matter from the external environment can significantly alter the disk properties as compared to those seen in the isolated model. Depending on the magnitude and direction of rotation of the external environment, a variety of disks can form including compact (≤200 AU) ones shrinking in size owing to infall of external matter with low angular momentum, as well as extended disks forming from infall of external matter with high angular momentum. The former are usually stable against gravitational fragmentation, while the latter are prone to fragmentation and formation of stellar systems with substellar/very-low-mass companions. In the case of a counter-rotating external environment, very compact (<5 AU) and short-lived (≲ a few 105 yr) disks can form when infalling material has low angular momentum. The most interesting case is found for the infall of counter-rotating external material with high angular momentum, leading to the formation of counter-rotating inner and outer disks separated by a deep gap at a few tens AU. The gap migrates inward owing to accretion of the inner disk onto the protostar, turns into a central hole, and finally disappears, giving way to the outer strongly gravitationally unstable disk. This model may lead to the emergence of a transient stellar system with planetary/substellar components counter-rotating with respect to that of the star.
Key words: protoplanetary disks / stars: formation / stars: protostars / hydrodynamics
© ESO, 2014
1. Introduction
Solar-type stars form from the gravitational collapse of dense molecular cloud cores, which in turn can be the product of supersonic turbulent compression (e.g. Padoan et al. 2001) or slow expulsion of the magnetic field due to ambipolar diffusion (e.g., Shu et al. 1987; Basu & Mouschovias 1994). A large fraction of the collapsing core passes through a protostellar disk, formed by conservation of the net angular momentum of the core, before finally landing on a protostar. The main accretion phase lasts until most of the parental core is accreted onto the disk plus protostar system or dispersed via feedback from stellar irradiation and outflows. In this “classic” scenario, the core is usually described by an isolated, initially unstable Bonnor-Ebert-type sphere or perturbed singular isothermal sphere.
However, recent observations indicate that dense molecular cores constitute part of a complicated filamentary structure in the spatial and velocity space, with individual filaments resembling a network of twisted and intersecting threads (Hacar et al. 2013). A general agreement between the measured core masses and those predicted from the linear stability analysis suggests that the cores are likely to form from the gravitational fragmentation of these filaments (Hacar & Tafalla 2011). In this picture, prestellar cores may not be described by a perfectly spherical shape and may be submerged into a varying density environment characterized by gas flows with varying angular momentum. As a net result, it is likely that the protostar plus disk system may continue accreting from the external environment even after the parental core has completely dissipated.
This conjecture seems to be supported by recent observations showing that large star-forming regions contain a population of relatively old stars (with age >10 Myr), which still have signatures of accretion disks (Beccari et al. 2010; De Marchi et al. 2013a,b). Scicluna et al. (2014) explain this phenomenon by invoking Bondi-Hoyle accretion to rebuild a new disk around these stars during passage through a clumpy molecular cloud. While it is difficult to determine the proper stellar age of accreting stellar objects (Baraffe et al. 2012) and it is not clear if Bondi-Hoyle accretion is the right mechanism for describing accretion onto the disk, the possible presence of quite old disks (with age much greater than the canonical disk-dispersal e-folding time of 3 Myr) supports the idea of prolonged accretion.
Theoretical and numerical studies of clustered star formation also suggest that accretion may continue from larger (than the initial extent of the parental core) spatial scales until the gas reservoir within the cluster is completely exhausted, leading to a constant accretion time that is proportional to the global freefall time of the cluster (e.g., McKee & Offner 2010; Dunham et al. 2014b). In particular, numerical simulations of, for example, Bate et al. (2010), Fielding et al. (2014), and Padoan et al. (2014) demonstrate that molecular clouds are turbulent and inherently chaotic environments, within which individual collapsing cores may accrete mass and angular momentum at a highly non-steady rate from a network of filaments interconnecting the cores. It is possible that the angular momentum vector of the accreted material can undergo significant changes both in magnitude and direction.
Finally, observations seem to indicate longer lifetimes of the main accretion phase, 0.42 Myr (Evans et al. 2009), than those derived from numerical simulations of isolated gravitationally unstable cores, 0.12 Myr (Vorobyov 2010; Dunham & Vorobyov 2012), again implying that mass infall onto the disk plus star system may continue after the initial parental core has dissipated.
In this paper, we explore the effect of prolonged gas infall onto the properties of circumstellar disks. In particular, we consider prestellar cores submerged into a low-density, external environment with varying angular momentum. As a first approximation, we assume that the external material has constant density and angular velocity. More realistic initial conditions taken from numerical hydrodynamics simulations of clustered star formation will be considered in a follow-up study.
2. Model description
Our numerical hydrodynamics model for the formation and evolution of a star plus disk system in the thin-disk limit is described in detail in Vorobyov & Basu (2010) and Vorobyov et al. (2013b) and is briefly reviewed below for the reader’s convenience. We start our numerical simulations from the gravitational collapse of a starless cloud core submerged into a low-density external environment; continue into the embedded phase of star formation, during which a star, disk, and envelope are formed; and terminate our simulations after approximately 0.5 Myr of disk evolution. The protostellar disk occupies the inner part of the numerical polar grid and is exposed to intense mass loading from the infalling envelope and external environment.
To avoid time steps that are too short, we introduce a “sink cell” at rsc = 5 AU and impose a free inflow inner boundary condition and a free outflow outer boundary condition so that that the matter is allowed to flow out of the computational domain but is prevented from flowing in. The sink cell is dynamically inactive; it only contributes to the total gravitational potential and secures a smooth behavior of the gravity force down to the stellar surface. During the early stages of the core collapse, we monitor the gas surface density in the sink cell, and when its value exceeds a critical value for the transition from isothermal to adiabatic evolution, we introduce a central point-mass object. In the subsequent evolution, 90% of the gas that crosses the inner boundary is assumed to land on the central object. The other 10% of the accreted gas is assumed to be carried away with protostellar jets.
The basic equations of mass, momentum, and energy transport in the thin-disk limit are ![Mathematical equation: \begin{eqnarray} \label{cont} &&\frac{{\partial \Sigma }}{{\partial t}} = - \nabla_p \cdot \left( \Sigma \bl{v}_p \right), \\ \label{mom} &&\frac{\partial}{\partial t} \left( \Sigma \bl{v}_p \right) + \left[\nabla \cdot \left( \Sigma \bl{v_p} \otimes \bl{v}_p \right) \right]_p = - \nabla_p {\cal P} + \Sigma \, \bl{g}_p + (\nabla \cdot \mathbf{\Pi})_p, \label{energ} \\ &&\frac{\partial e}{\partial t} +\nabla_p \cdot \left( e \bl{v}_p \right) = -{\cal P} (\nabla_p \cdot \bl{v}_{p}) -\Lambda +\Gamma + \left(\nabla \bl{v}\right)_{pp^\prime}:\Pi_{pp^\prime}, \end{eqnarray}](/articles/aa/full_html/2015/01/aa24583-14/aa24583-14-eq7.png) where subscripts p and p′ refer to the planar components (r,φ) in polar coordinates, Σ is the mass surface density, e the internal energy per surface area,
where subscripts p and p′ refer to the planar components (r,φ) in polar coordinates, Σ is the mass surface density, e the internal energy per surface area,  the vertically integrated gas pressure calculated via the ideal equation of state as
  , Z the radially and azimuthally varying vertical scale height determined in each computational cell using an assumption of local hydrostatic equilibrium,
  is the velocity in the disk plane, and
  is the gradient along the planar coordinates of the disk. The dependence of γ on temperature is parameterized based on the work of Masunaga & Inutsuka (2000) with γ = 7/5 for the gas temperature less than 100 K and γ = 5/3 otherwise1. The gravitational acceleration in the disk plane,
  , takes self-gravity of the disk into account, found by solving for the Poisson integral (see details in Vorobyov & Basu 2010), and the gravity of the central protostar when formed. Turbulent viscosity is taken into account via the viscous stress tensor Π, the expression for which is provided in Vorobyov & Basu (2010). We parameterize the magnitude of kinematic viscosity ν using the α prescription with a spatially and temporally uniform α = 1.0 × 10⁻².
Model parameters.
The radiative cooling Λ in Eq. (2) is determined using the diffusion approximation of the vertical radiation transport in a one-zone model of the vertical disk structure (Johnson & Gammie 2003)  (4)where σ is the Stefan-Boltzmann constant,
  is the midplane temperature of gas2, μ = 2.33 the mean molecular weight, R the universal gas constant, and ℱc = 2 + 20tan-1(τ)/(3π) is a function that secures a correct transition between the optically thick and optically thin regimes. We use frequency-integrated opacities of Bell & Lin (1994). The heating function is expressed as
  (5)where Tirr is the irradiation temperature at the disk surface determined by the stellar and background blackbody irradiation as
  (6)where Tbg is the uniform background temperature (in our model set to the initial temperature of the natal cloud core), and Firr(r) the radiation flux (energy per unit time per unit surface area) absorbed by the disk surface at radial distance r from the central star. The latter quantity is calculated as
  (7)where γirr is the incidence angle of radiation arriving at the disk surface (with respect to the normal) at radial distance r.
The stellar luminosity L∗ is the sum of the accretion luminosity L∗ ,accr = GM∗Ṁ/ 2R∗ arising from the gravitational energy of accreted gas and the photospheric luminosity L∗ ,ph due to gravitational compression and deuterium burning in the stellar interior. The stellar mass M∗ and accretion rate onto the star Ṁ are determined using the amount of gas passing through the sink cell. The properties of the forming protostar are calculated using a stellar evolution code described in Baraffe & Chabrier (2010). This code is coupled with the main hydrodynamical code in real time. However, owing to heavy computational load the stellar evolution code is only invoked to update the properties of the protostar every 20 yr, while the hydrodynamical time step may be as short as a few weeks, and the entire duration of numerical simulations may exceed 1.0 Myr. The input parameter for the stellar evolution code is the accretion rate Ṁ, while the output are the radius and photospheric luminosity of the protostar. This coupling of the disk and protostar evolution allows for a self-consistent determination of the radiative input of the protostar into the disk thermal balance, which is important for accurate study of disk instability and fragmentation.
3. Initial conditions
As the initial setup, we take a prestellar core submerged into a constant-density external environment. For the initial surface density profile of the core, we adopt a simplified form of a vertically integrated Bonnor-Ebert sphere (Dapp & Basu 2009) The resulting initial distribution of the gas surface density takes the following form  (8)where Σ0 is the gas surface density at the center of the core,
  is the radius of the central plateau of the core, Rcore the radius of the core, cs the initial sound speed, and Σext the density of the external environment, the value of which is set equal to the gas surface density at the outer edge of the core (
 ). In all models the value of A is set to 1.2 and the initial temperature is set to 10 K.
To study the effect of infall from the external environment characterized by varying angular momentum, we adopt the following form for the initial radial profile of angular velocity Ω (9)where Ωcore is the angular velocity of the core and C a dimensionless scaling factor defining the angular velocity in the external environment. The angular velocity profile between the core and the external environment is smoothly joined at the outer edge of the core.
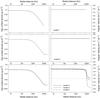 |
Fig. 1 Initial distribution of the gas surface density (left panels) and angular velocity (right panels) in five considered models. The horizontal dotted line marks the zero angular velocity. |
We have considered five models and the initial setup is shown in Fig. 1. In particular, the left hand panels present the radial distribution of Σ, while the right hand panels show Ω as a function of radial distance. Model 1 represents a uniformly rotating isolated core (no external environment) with mass 0.63 M⊙ and ratio of rotational to gravitational energy β = 0.51%. Models 2−5 consider the same core submerged into the external environment with different angular velocities. In particular, Model 2 has a corotating external environment with the same angular velocity as that of the core, while in Model 3 the angular velocity of the external environment is ten times smaller than that of the core. Models 4 and 5 are characterized by a counter-rotating external environment. In particular, in Model 4 the external angular velocity is ten times lower in absolute value than that of the core, while in Model 5 the external angular velocity is equal to that of the core in absolute value. In Models 2−5 the radial distribution of gas surface density is identical. The parameters of every model are provided in Table 1.
4. Results
In this section, we start with considering the properties of a protostellar disk formed from the gravitational collapse of an isolated prestellar core and continue by considering models that take the effect of external environment into account.
4.1. The isolated model
As a prototype model, we consider an isolated prestellar core with mass 0.63 M⊙ and ratio of rotational to gravitational energy β = 5.3 × 10⁻³ (hereafter, Model 1). This choice is motivated by our previous numerical hydrodynamics simulations indicating that protostellar disks formed from cores with similar characteristics are expected to be gravitationally unstable and prone to fragmentation in the early embedded stage of stellar evolution (Vorobyov 2011). Figure 2 presents the time evolution of the gas surface density in Model 1 in the inner 1000 × 1000 AU box. The whole computational region extends to 10 000 AU. The time elapsed from the formation of the central star is indicated in each panel. The scale bar is in log g cm-2, and the lower surface density threshold set to log Σ = −1.5 g cm-2 so that the black region is not empty but filled with a low density material falling onto the disk from the parental core.
The protostellar disk in Model 1 becomes gravitationally unstable at a very early stage of evolution (as manifested by a spiral structure already present at t = 0.08 Myr) owing to continuing mass loading from the infalling core. The first fragment forms in the disk after t = 0.15 Myr, when the disk mass and radius begin to exceed 0.1 M⊙ and 100 AU, respectively. This agrees with many previous numerical and theoretical studies, indicating that the disk needs to acquire a critical mass (≳0.1 M⊙) and grow to a critical size (≳50 − 100 AU) before gravitational fragmentation can ensue (Stamatellos & Whitworth 2008; Rice et al. 2010; Vorobyov 2011; Meru & Bate 2012). We used the fragment tracking algorithm described in Vorobyov (2013) to calculate the masses of the fragments. The fragments were identified based on two conditions: 1) the fragment must be pressure-supported, with a negative pressure gradient with respect to the center of the fragment; and 2) the fragment must be kept together by gravity, with the potential well being deepest at the center of the fragment. The resulting masses of the fragments lie in the 2.5–5.0 MJup range.
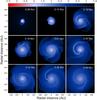 |
Fig. 2 Gas surface density maps in Model 1 in the inner 1000 × 1000 AU box obtained at several evolution times (as marked in each panel) after the formation of the central protostar. The scale bar is in log g cm-2. |
One can see in Fig. 2 that the process of disk fragmentation in Model 1 is not continuous but intermittent, where time intervals showing fragments alternate with intervals showing no signs of disk fragmentation. The timescale with which the disk fragments is determined by the ratio (Vorobyov et al. 2013a)  (10)where Md is the disk mass and Ṁinfall the rate of mass infall from the parental core onto the disk. Taking 0.15 M⊙ and 10-6M⊙ yr-1 for the typical values of Md and Ṁinfall (see Figs. 10 and 11), we obtain Tfr = 0.15 Myr, which appears to agree (within a factor of unity) with a visually estimated value of Tfr ≈ 0.1 Myr (see Fig. 2). The lifetime of fragments is usually shorter than 0.1 Myr, either due to migration on the central protostar or destruction via tidal torques (Stamatellos et al. 2011; Vorobyov et al. 2013a), resulting in prolonged periods of disk evolution without fragments. Finally, it is worth noting that the disk forms only one fragment at a time, which implies that ejection of fragments into the intercluster medium due to gravitational many-body interaction in such a system is impossible (Basu & Vorobyov 2012).
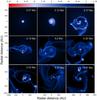 |
Fig. 3 Gas surface density maps in Model 2 in the inner 1000 × 1000 AU box (top row) and 2000 × 2000 AU box (middle and bottom rows) obtained at several evolution times (as marked in each panel) after the formation of the central protostar. The scale bar is in log g cm-2. |
As many numerical studies indicate, a fragment can be driven into the disk’s inner regions and probably onto the star (Vorobyov & Basu 2006, 2010; Machida et al. 2011a; Cha & Nayakshin 2011), ejected into the intracluster medium (Basu & Vorobyov 2012), dispersed by tidal torques (Boley et al. 2010; Zhu et al. 2012), or even survive and settle onto quasi-stable, wide-separation orbits (Vorobyov 2013). In Model 1, there are no accretion bursts that could be triggered by fragments migrating onto the star (see Fig. 11). There are also no ejections or survival of the fragments. This leaves us only with one outcome: the fragments in Model 1 have been tidally dispersed.
4.2. The effect of external environment: corotating infall
In this section we consider Models 2 and 3 in which a prestellar core is submerged in an external environment corotating with the core. Figure 3 presents the gas surface density maps in Model 2 at the same evolution times as in Fig. 2 for the isolated core. The top panels have a size of 1000 × 1000 AU centered on the star, while the other panels have a twice larger size. The early evolution in Model 2 (t ≤ 0.12 Myr) is similar to that of Model 1: the disk is gravitationally unstable showing a flocculent spiral structure and no signs of fragmentation. This is explained by the fact that during this early period the disk accretes the matter from the parental core rather than from the external environment.
The effect of the external environment becomes evident at t> 0.15 Myr when its matter starts reaching the disk surface. In this phase, the disk evolution in Model 2 becomes strikingly different from the isolated Model 1. Violent gravitational instability and fragmentation lead to almost complete disintegration of the disk. The system now resembles a multicomponent stellar system connected with dense filaments, within which individual components tend to form their own minidisks. The masses of the fragments span a range from a few Jupiters to very-low-mass stars, with the most massive fragment having a mass of 0.18 M⊙.
As the next step, we investigate Model 3 which is characterized by the external environment rotating at a ten times smaller angular velocity than that of the core. Figure 4 presents the gas surface density maps in Model 3 in the same spatial box of 1000 × 1000 AU and at similar evolution times to those of the isolated Model 1 (see Fig. 2). The early evolution at t ≤ 0.12 Myr is similar in both Models 1 and 3. The disk is weakly gravitationally unstable and develops a flocculent spiral structure. A significant difference in the disk appearance between Models 1 and 3 is seen after t = 0.15 Myr, when infall from the external environment triggers a vigourous gravitational instability and fragmentation in the disk. Unlike Model 1, however, the process of disk fragmentation in Model 3 seems to be continuous (in the time interval of t = 0.15 − 0.25 Myr) and is characterized by the presence of multiple fragments. This is explained by the fact that the time period between disk fragmentation episodes Tfr = 5 × 10⁴ yr, calculated using Eq. (10) and typical disk masses and infall rates (Md = 0.25 M⊙ and Ṁinfall = 5 × 10⁻⁶M⊙ yr-1), appears to be comparable to the longest migration times of fragments onto the central protostar (Vorobyov et al. 2013a). As a net result, some of the fragments are always present in the disk. The masses of the fragments range from 3.0 MJup to 15 MJup.
The phase of vigourous disk fragmentation ends after t = 0.26 Myr and no fragments are seen in the disk afterward. The disk shrinks notably in size, and its subsequent evolution is characterized by the presence of a weak flocculent spiral structure. This drastic change in the disk evolution as compared to Model 2 (the latter showing vigorous fragmentation at these evolutionary times) can be attributed to low angular momentum of the infalling external environment, which exerts a negative torque onto the disk. This causes the disk to shrink in size. Although the disk mass remains substantial at this phase (see Sect. 5), a small size (≲100 AU) and high disk temperature (≈200 K) make gravitational fragmentation unlikely.
4.3. The effect of external environment: counter-rotating infall
In this section we consider the effect of infall from the external environment counter-rotating with respect to the prestellar core. As the first step, we consider Model 4 with external environment counter-rotating (with respect to the core) at an angular velocity ten times lower than that of the core. Figure 5 presents the gas surface density maps for Model 4 for the same regions and evolution times as in the isolated Model 1. The early evolution of the disk in Model 4 (t ≤ 0.18 Myr) bears some similarity to the disk evolution in the isolated Model 1 – the disk rotates counter-clockwise, it is gravitationally unstable and shows clear signs of fragmentation. The fragments have masses around 4.0 MJup. The drastic change with respect to all models considered so far is seen at t> 0.18 Myr when the disk starts to quickly shrink in size and virtually disappears after t = 0.2 Myr owing to a strong negative torque exerted by the infalling external environment counter-rotating with respect to the disk. The disk loses its rotational support and accretes onto the star, leading to a steep increase in the stellar mass, as is evident in Fig. 10. This example demonstrates how the counter-rotating external environment can significantly shorten the lifetime of circumstellar disks.
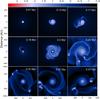 |
Fig. 6 Gas surface density maps in Model 5 in the inner 1000 × 1000 AU box (top row) and 2000 × 2000 AU box (middle and bottom rows) obtained at several evolution times (as marked in each panel) after the formation of the central protostar. The scale bar is in log g cm-2. |
For the second step, we consider Model 5 with external environment counter-rotating (with respect to the core) with the same angular velocity as that of the core. Figure 6 presents the gas surface density in Model 5 in the inner 1000 × 1000 AU box (top row) and in the inner 2000 × 2000 AU box (middle and bottom rows). The early evolution (t ≤ 0.17 Myr) in Models 4 and 5 is very similar: the disk in both models is gravitationally unstable and shows signs of fragmentation. The masses of the fragments lie in the 4.0–7.0 MJup range.
The subsequent evolution of the disk in Model 5 is, however, quite different from any model considered so far. First, the disk shrinks in size to just a few tens of AU at t = 0.18 Myr owing to a strong negative torque exerted by the counter-rotating infalling material. Then, an outer disk forms, rotating in the opposite direction with respect to that of the inner, heavily reduced disk. During this transformation, a notable cavity develops in the gas surface density at a radial distance of a few tens of AU. This process is illustrated in Fig. 7 showing the gas velocity field superimposed on the gas surface density in the inner 600 × 600 AU box during a narrow time period of 8 kyr. The infall of counter-rotating envelope onto the disk is already evident at t = 0.175 Myr, leading to a sharp reduction in the disk size by t = 0.18 Myr. The outer counter-rotating disk starts forming at t = 0.181 Myr and becomes fully developed by t = 0.183 Myr. The inner edge of the cavity is initially located at r ≈ 30 AU.
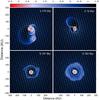 |
Fig. 7 Development of a cavity in the disk. Shown with yellow arrows is the gas velocity field superimposed on the gas surface density in the inner 600 × 600 AU box in Model 5. The bar is in log g cm-2. |
The time evolution of the cavity can be best described with the series of azimuthally averaged gas surface density ( ) profiles shown in Fig. 8. The radial profile of in the early evolution is characterized by a near-constant-density central region (≲30 AU) and a steeply declining tail at larger radii. The cavity appears at t = 0.18 Myr and become fully developed by t = 0.19 Myr, with the maximum contrast in between the lowest value in the cavity and the maximum values in the inner and outer disks on the order of 900 and 40, respectively. As time progresses, the cavity moves closer to the central star because the matter from the outer disk flows through the cavity onto the inner disk, exerting a negative torque on the latter. By t = 0.22 Myr the cavity turns into a central hole when the inner disk becomes smaller than the size of our sink cell. Finally, by t = 0.25 Myr, the central hole fills in and the subsequent profile of becomes typical for massive, strongly unstable disks with local sharp maxima representing fragments embedded in the disk.
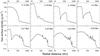 |
Fig. 8 Time series of azimuthally averaged gas surface density profiles ( |
After t = 0.2 Myr, the disk experiences a second vigorous episode of disk fragmentation, leading in the end to its almost complete disintegration and formation of a multiple system of fragments connected with dense filaments. The masses of the fragments at this stage reach a much higher value, ranging from 7.0 to 82 Jupiter masses.
The difference in the properties of circumstellar disks formed in the considered models can be understood by analyzing the centrifugal radius of matter initially located at a distance r from the star: 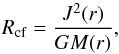 (11)where J(r) = r2Ω is the specific angular momentum at a radial distance r, G is the gravitational constant, and M(r) the mass enclosed within distance r. Figure 9 presents the centrifugal radius as a function of distance for various initial distributions of mass and angular momentum in Models 1–5. More specifically, the thick black line shows Rcf for the isolated pre-stellar core in Model 1, while the solid red and dashed red lines provide the centrifugal radius in Models 2 and 3 characterized by a corotating external environment. The solid blue and dashed blue lines show Rcf for Models 4 and 5 characterized by a counter-rotating external environment.
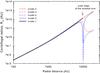 |
Fig. 9 Centrifugal radius Rcf as a function of radial distance in Models 1–5. |
The centrifugal radius in Model 1 is gradually increasing with distance and reaches a maximum value of 132 AU for the material located at the core outer edge (shown by the arrow). We note, however, that the disk in Model 1 has in fact grown to a size greater than suggested by the maximum centrifugal radius of Rcf = 132 AU (see Fig. 2) due to viscous spreading.
The radial profile of Rcf in Model 2 (solid red line) is similar to that of Model 1, except that the matter of the external environment is characterized by a gradually increasing Rcf reaching a maximum value of 791 AU. As a net result, the disk in Model 2 grows to a larger size and becomes more massive than in Model 1 (see Fig. 10), finally breaking into a series of fragments owing to violent gravitational instability. In Model 3, however, the external environment has a much lower angular velocity than does the core. As a consequence, the centrifugal radius of the external environment gradually declines to just several AU (dashed red line). The infalling material from the external environment with a substentially sub-Keplerian rotation exerts an ever increasing negative torque onto the disk outer regions. This causes the disk to shrink in size with time as is evident in Figs. 4 and 10.
The last two models 4 and 5 are characterized by external environment rotating in the opposite direction to that of the core. In Model 4, characterized by angular velocity of the external environment 10 times smaller than that of the core, the centrifugal radius first grows with distance (as in Model 1) but then shows a sharp drop near the core outer edge where the angular velocity changes its sign. Rcf of the external material always stays below several AU. As a result, the infalling external material with a counter-rotating sub-Keplerian velocity exerts a strong negative torque onto the disk outer regions. The disk shrinks to a smaller size than our sink cell (5 AU) and virtually disappears in Fig. 5.
In Model 5 the angular velocity of the counter-rotating external environment is the same as that of the core. As a consequence, Rcf first drops to a low value near the core outer edge (where the rotation changes its sign) but then quickly grows to a maximum value of 685 AU. This causes the disk first to shrink in size, when the low-Rcf material from the external environment hits the disk and starts extracting disk’s angular momentum. Then, the infalling external material characterized by a constantly growing Rcf hits the centrifugal barrier just outside the heavily reduced inner disk and the outer, counter-rotating disks begins to form. The transition region between the inner and outer disks, where rotation changes its direction and the matter lacks centrifugal support, is manifested by a density gap clearly visible at t = 0.2 Myr in Fig. 6.
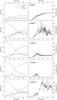 |
Fig. 10 Left column: masses of the disk (solid lines), star (dashed lines), and envelope (dash-dotted lines) as a function of time elapsed since the formation of the protostar in Models 1–5 (from top to bottom rows). Right column: the corresponding disk radii. |
5. Comparison of disk properties
In this section, we compare various properties of our model disks including the disk masses and sizes, which were computed using the disk tracking algorithm. The disk mass and radius are calculated at each time step by disentangling the disk and infalling envelope on the computational mesh. We do this in practice by adopting a surface density threshold of Σcr = 0.5 g cm-2 between the disk and envelope and also using the radial gas velocity profile. This method is described in detail by Vorobyov (2011, see Fig. 1 and the pertinent text). The values of the disk radius and mass both depend somewhat on the adopted threshold. Nevertheless, a lower value of Σcr = 0.1 g cm-2 results only in a few percent increase in the net disk mass (see Fig. 2 in Dunham et al. 2014a).
We found that our algorithm generally works well, but may somewhat overestimate the disk mass in the early Class 0 stage (when the inner part of the infalling envelope may have densities exceeding Σcr) and somewhat underestimate the disk mass in the late Class I and Class II stages (when the disk spreads out and its density drops below Σcr in the outer parts). The envelope mass includes both the matter in the core and external environment (when present).
The left column in Fig. 10 presents the integrated disk masses Md, stellar masses M∗, and envelope masses Menv as a function of time passed since the formation of the central protostar, while the right column shows the corresponding disk radii Rd. Each row corresponds to a particular model as indicated in the figure. In Model 1, the disk mass steadily grows and reaches a maximum value of Md ≈ 0.16 M⊙ at t ≈ 0.2 Myr, gradually declining afterwards. The growth rate of the protostar exceeds that of the disk and the final mass of the star is expected to be about M∗ = 0.45 M⊙. The envelope mass steadily decreases and the model enters the Class II stage, defined as the time when less than 10% of the initial mass reservoir is left in the envelope, at t ≈ 0.25 Myr. The disk grows in radius showing small radial pulsations and reaches a maximum value of Rd ≈ 400 AU at t ≈ 0.5 Myr. All in all, this model demonstrates standard behavior to what has been found in previous numerical simulations of isolated collapsing cores (e.g. Vorobyov 2011).
The properties of the forming star plus disk system in Model 2 are strikingly different from those of Model 1. First, the disk mass reaches a maximum value of 0.54 M⊙, three times greater than that in Model 1. Second, the disk radius exhibits large variations, which are indicative of significant radial motions within the disk caused by the gravitational interaction between the fragments and elements of spiral arms3. Third, the central star experiences several episodes of sharp increase in mass caused by accretion of infalling fragments, the effect discussed in more detail in Sect. 6 below. The final stellar mass is expected to be around 0.8 M⊙. After t = 0.5 Myr, there is still 30% of the total mass available for accretion onto the disk+star system, indicating that the system is still in the embedded phase. We note that the mean duration of the embedded phase obtained in numerical hydrodynamics simulations of collapsing isolated cores (≈0.15 Myr, albeit with a large scatter depending on the core mass) appears to be shorter by a factor of 3–4 than obtained by analyzing the number of embedded and Class II sources in star-forming regions (Vorobyov 2010; Dunham & Vorobyov 2012). A prolonged accretion from the external environment may provide a possible solution to this problem.
Model 3 with a slowly corotating external environment is peculiar in several aspects. On the one hand, the disk radius stays around 100 AU during most of the evolution, exceeding 200 AU only for a limited period. On the other hand, the disk mass becomes at least a factor of 2 greater than in Model 1, indicating the formation of a dense and compact disk. Thanks to an elevated mass transport through the disk caused by infall of low-angular-momentum material from the external environment, the final stellar mass is likely to exceed M∗ = 1.2 M⊙, in the long run forming a substantially more massive object than in Models 1 and 2. The envelope mass after t = 0.5 Myr is 5% of the total available mass, indicating that the system has entered the Class II stage. To summarize, Model 3 is capable of forming compact and dense disks around solar-mass stars.
Model 4, which is characterized by a slowly counter-rotating external environment, is unique. The negative torque exerted onto the disk by infalling counter-rotating material leads to complete accretion of the disk onto the protostar by t = 0.2 Myr. A small circumstellar disk may still exist on sub-AU scales, as suggested by the centrifugal radius in Fig. 9, but we cannot confirm its presence in our numerical simulations because of the use of a sink cell at r = 5 AU. In the subsequent evolution, the forming star is likely to accrete material either from a small sub-AU disk or directly from the infalling envelope. The fraction of stars with detectable near-infrared disk emission seems to approach 80−90% for objects with an age less than 1.0 Myr (Hernandez et al. 2007), suggesting that systems like those explored in Model 4 are rare.
Finally, Model 5 presents a very curious case showing the reversal of the disk rotation due to the infall of counter-rotating external material. The initial disk growth is followed by a sharp decline when the disk mass and size drop to just 0.07 M⊙ and ≲100 AU at t ≈ 0.18 Myr, indicating the beginning of the disk reversal phase. In the subsequent stage, the disk evolution is similar to that of Model 2, showing vigorous gravitational instability and fragmentation. The final stellar mass is expected to be slightly below that of the Sun. The formation of systems with disks counter-rotating to that of the star is rare, with RW Aur A one possible example showing both the disk and jet counter-rotating with respect to the rotation of the host binary system (Woitas et al. 2005; Bisikalo et al. 2012).
We want to mention that the gas temperature in Models 3–5, which feature compact disks during the evolution, becomes comparable to or higher than 200 K at r = 10 − 20 AU, a value that is at least a factor of two greater than in the isolated Model 1. We cannot calculate the gas temperature at the sub-AU scales, but by extrapolating the T ∝ r− 1/2 profile, we speculate that the temperature at r = 0.5 AU can reach values on the order of 1200 K, which is close to what is needed for forming calcium-aluminium-rich inclusions (CAIs). Numerical simulations with a smaller sink cell are planned for the future to investigate this possibility.
Table 2 summarizes the main properties of the forming objects in Models 1−5. The mean values are calculated starting from the formation of the disk and ending at t = 0.5 Myr after the formation of the protostar. In Model 4, the mean values were taken over the time period covering the actual existence of the disk.
Main model properties.
6. Accretion and infall rates
In this section we compare the mass accretion rates through the sink cell Ṁ and mass infall rates at a distance of 2000 AU from the star Ṁinfall in our five models. Figure 11 presents Ṁ and Ṁinfall as a function of time elapsed since the formation of the first hydrostatic core (FHC) in Models 1–5 (from top to bottom).
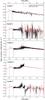 |
Fig. 11 Mass accretion rates through the sink cell at r = 5 AU (black solid lines) and mass infall rates at r = 2000 AU (red dashed lines) in Models 1–5 (from top to bottom). |
The accretion rate in Model 1 shows a time behavior typical of weakly gravitationally unstable disks (Vorobyov & Basu 2010). Here, Ṁ is negligible in the prestellar phase and rises to a maximum value of 1.3 × 10⁻⁵M⊙ yr-1 when the FHC forms at t = 0 Myr. The subsequent short period of evolution is characterized by a gradually declining Ṁ when the material from the core lands directly onto the forming star. A sharp drop in the accretion rate at t = 0.045 Myr indicates the beginning of the disk formation phase when the infalling core material hits the centrifugal barrier near the sink cell and the accretion rate drops to a negligible value. However, the process of mass loading from the core continues, the disk grows in mass and size, and the disk quickly becomes gravitationally unstable. In the subsequent evolution, Ṁ shows order-of-magnitude flickering and gradually declines with time to a value of 10-7M⊙ yr-1 at t = 0.5 Myr. We note that Model 1 exhibits no accretion bursts with magnitude ≳10-4M⊙ yr-1, as might be expected for models with fragmenting disks whereby fragments migrate onto the star due to gravitational interaction with spiral arms (Vorobyov & Basu 2006, 2010). This indicates that the fragments in Model 1 (see Fig. 2) were tidally destroyed before reaching the inner sink cell. We also note that Ṁinfall in Model 1 exceeds Ṁ only during the early evolution of the disk (t ≈ 0.05 − 0.2 Myr) and both values are similar in magnitude in the subsequent evolution. The inequality Ṁinfall>Ṁ is one of the conditions for disk gravitational fragmentation (e.g. Vorobyov & Basu 2010; Kratter et al. 2010), explaining the presence of fragments in the disk of Model 1.
The early evolution of Ṁ in Model 2 is similar to that of Model 1. A notable difference comes about after t = 0.15 Myr when Ṁ begins to show variations by several orders of magnitude. Accretion bursts, some of which exceed in magnitude 10-4M⊙ yr-1, are caused by disk gravitational fragmentation followed by migration of the fragments onto the forming protostar, a phenomenon known as the burst mode of accretion (Vorobyov & Basu 2006, 2010). The number of bursts in this particular model amounts to a few tens and the burst activity subsides in the early Class II stage. The mass infall rate Ṁinfall is greater on average than Ṁ, thus leading to the accumulation of mass in the disk and strengthening its gravitational instability and propensity to fragment. To check this supposition, we calculated the spatial distribution of the Gammie parameter  , where tc = e/ Λ is the local cooling time, and the Toomre parameter Q = csΩ/(πGΣ). Disk fragmentation is supposed to occur in regions where both quantities become smaller than unity (e.g., Gammie 2001; Rice et al. 2003). We found that during the initial disk evolution, unaffected by infall from the external environment, the Q-parameter becomes smaller than unity only in a few spots in the disk, while the regions with
  cover a much larger area, indicating that the insufficient strength of gravitational instability (rather than slow disk cooling) is the main hindrance to fragmentation. On the other hand, during the external infall stage, the regions with Q< 1 occupy a notably larger area, while the spatial area with
  remains similar to what was found during the early stage, meaning that the infall from the external environment is the dominant effect driving the disk to the fragmentation boundary.
We note that Ṁinfall sometimes shows large variations caused by the perturbing influence of the disk. More specifically, the gravitational interaction between fragments and spiral arms within the disk sometimes leads to ejections of individual fragments or elements of spiral arms to distances on the order of thousands AU.
The mass accretion rate in Model 3 with a slowly corotating external environment exhibits a much smaller accretion variability than that of Model 2. There are only two strong accretion bursts around 0.18−0.2 Myr and the later evolution of Ṁ is only characterized by small-scale flickering. On average, Ṁ is higher in Model 3 than in Models 1 and 2, staying in the 10-6 − 10-5M⊙ yr-1 range during the initial 0.5 Myr of evolution. The matter from the external environment falling in onto the disk at a substantially sub-Keplerian speed acts to reduce the disk rotational support, thus increasing the mass flow through the disk onto the star. We note that Ṁinfall is greater than Ṁ at t< 0.20 Myr, causing disk fragmentation in the early disk evolution (see Fig. 4), but both values become comparable in the later evolution, indicating the presence of efficient mass transport through the compact and hot disk owing to the increasing strength of viscous torques.
The effect of the external environment in Model 4 is manifested by a gradual increase in the mass accretion rate after t = 0.16 Myr to ≳10-5M⊙ yr-1 (on average). This increase is even more pronounced than in Model 3 because the infalling external material in Model 4 counter-rotates with respect to the disk, thus exerting a stronger negative torque onto the disk outer regions than in Model 3. As a net result, the disk loses rotational support and the mass transport rate through the disk increases leading to a complete disappearance of the disk after t = 0.22 Myr. In the subsequent evolution, both Ṁ and Ṁinfall are nearly identical and slowly decline with time.
Finally, the early evolution of Ṁ in Model 5 is very similar to Model 4. After an initial period of near constant accretion at a value of ≈10-6M⊙ yr-1, the mass accretion rate shows a transient increase by an order of magnitude during t = 0.15 − 0.22 Myr. During this period, the matter is accreted from the inner disk, which is gradually losing its rotational support and shrinking in size due to the infall of matter from the counter-rotating external environment. At t ≈ 0.23 Myr, the inner disk reduces to a size smaller than the sink cell and Ṁ drops substantially. In the subsequent evolution, the matter is accreted from the outer, counter-rotating disk. Because the infall rate Ṁinfall is greater on average than the mass accretion rate onto the star Ṁ, the outer disk quickly becomes gravitationally unstable, leading high-amplitude variations in Ṁ. It is interesting to note that the later evolution shows only one moderate accretion burst at t ≈ 0.3 Myr, implying that fragments forming in the disk (see Fig. 6) are either tidally dispersed or may stay in the system with a possibility of forming in the long run a multicomponent planetary system.
7. Discussion: the variety of disk properties
Observations of star-forming regions indicate that the fraction of (sub-)solar-mass stars with circumstellar disks approaches 80−90% for objects with an age equal to or smaller than 1.0 Myr (Hernandez et al. 2007). The young disks seem to have diverse properties with masses ranging from a few Jupiters to a fraction of solar mass and sizes from a few to hundreds of AU (Andrews et al. 2009; Jorgensen et al. 2009; Eisner 2012; Tobin et al. 2012).
The observed variety of disk properties can in principle be reproduced by variations in the mass, angular momentum, and magnetic field strength of isolated parental cores. For instance, numerical hydrodynamics simulations of the gravitational collapse of non-magnetized isolated cores (Vorobyov 2011) yield the following near-linear relation between the disk masses and the masses of the central substellar/low-mass object 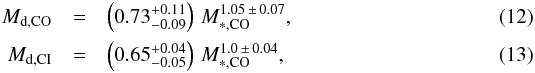 where the indices CO and CI correspond to the Class 0 and Class I phases, respectively. The minimum and maximum disk masses span a range from 0.02 M⊙ to 0.4 M⊙. At the same time, observations of embedded sources infer disks with the lower limit extending to just one Jupiter mass (Jorgensen et al. 2009; Tobin et al. 2012) and, in some cases, fail to detect disks at all (Maury et al. 2010). Systems with very-low-mass disks (Md ≲ 0.01 M⊙) can be the result of efficient magnetic braking operating in the embedded phase of star formation (Machida et al. 2011b; Seifried et al. 2012) or can simply be formed from cores with very low angular momentum and, subsequently, having a very small centrifugal radius. The situation is similar for disk radii: numerical simulations of isolated non-magnetized cores (Vorobyov 2011) seem to yield disk sizes that are a factor of several greater than inferred from observations (Tobin et al. 2012; Eisner 2012).
In this paper, we have explored the evolution of prestellar cores submerged into an external environment and found that its effect can add another dimension to the variety of disk properties around (sub-)solar-mass stars. Depending on the value of angular velocity and the direction of rotation of the external environment with respect to the core, the resulting disks can be characterized by vastly different physical parameters, such as masses, sizes, lifetimes, and accretion rates onto the host star. The external environment can affect the strength of gravitational instability in the disk and hence the likelihood of giant planet and brown dwarf formation. The effect can actually work both ways by suppressing or promoting disk gravitational fragmentation depending on the amount of rotation of the external material.
Models 3 and 4 with a slowly rotating external environment predict the formation of compact disks with radii ≤200 AU and, in some cases, even smaller than 5 AU (the size of our central sink cell). Even Model 2 with a fast-rotating environment is characterized by a more compact disk (than the isolated Model 1) in the late evolution, which is likely explained by the loss of angular momentum carried away by fragments accreted onto the star4. Observational estimates of disk radii seem to indicate that the majority of embedded and T Tauri disks are indeed rather compact, Rd = 50 − 200 AU (Vicente & Alves 2005; Tobin et al. 2012; Murillo et al. 2013).
Perhaps, the most interesting finding of our numerical modeling is the ability to form disks with cavities or holes in the case of counter-rotating external environment. These features are transient with the lifetime of a few tens of kyr and are characterized by counter-rotating inner and outer disks. In our model, the gap is located at ≈30−50 AU, which is similar with the position of the gap in, e.g., LkHα 330 (Brown et al. 2008). The gap migrates inward with time, gradually transforming into a central hole. Though being a short-lived phenomenon, this mechanism of the gap or hole formation can present an interesting alternative to other mechanisms, such as disk photoevaporation by the central star (Clarke et al. 2001; Owen et al. 2010) or gravitational clearing due to a massive planet (e.g. Kley et al. 2001).
After the inner, corotating disk vanishes due to accretion of its material onto the star, a stellar system with a disk counter-rotating with respect to that of the star emerges. If the disk is sufficiently massive to fragment, this process may lead to the formation of a system with planetary/substellar components counter-rotating with respect to the host star. This phenomenon may, however, be transient in nature. The reason is that angular momentum in the external environment is usually much greater than that of the star, and the latter may change stellar rotation to match that of the infalling material. Although the efficiency of this process should depend on how much angular momentum is lost via jets and outflows and whether or not a binary or multiple stellar system forms instead of a single star, such counter-rotating systems are nevertheless expected to be rare, with RW Aur A being one possible example (Woitas et al. 2005; Bisikalo et al. 2012).
We note that we have considered a rather simplified initial setup, treating the external environment as a homogeneous medium of constant density and angular velocity. In reality, however, the external environment is likely to have a complicated velocity and density structure as often seen in numerical hydrodynamics simulations of clustered star formation. For instance Bate et al. (2010), Fielding et al. (2014), and Padoan et al. (2014) all demonstrate that individual cores may accrete mass and angular momentum at a highly non-steady rate thanks to a filamentary and chaotic structure of the intracluster medium, leading to the formation of misaligned star-disk systems (the misalignment in some transient cases exceeds 90°). It is therefore possible that the angular momentum vector of the accreted material can undergo significant changes, including its orientation with respect to that of the core. Moreover, the dynamics of dust particles also needs to be considered because the holes/gaps in the disk are often identified through the lack of dust emission there. Finally, we acknowledge that the external mass in our models (Mext = 1.0 M⊙) is greater than that of the core (0.63 M⊙), which may have amplified the effect of infall from the external environment. Models with lower Mext need to be also investigated in order to evaluate the dependence of our results on the available mass in the external reservoir. We plan to consider more realistic initial configurations, lower external mass, and the dynamics of dust in a subsequent study.
8. Conclusions
For this paper we performed numerical hydrodynamics simulations of the gravitational collapse of a prestellar core with subsolar mass submerged into a low-density external environment characterized by different magnitude and direction of rotation with respect to the core. We followed the evolution of our models through the star and disk formation stages and terminated the simulations when the age of the forming star started to exceed 0.5 Myr. In all models, the mass of the core and external environment were fixed at 0.63 M⊙ and 1.0 M⊙, respectively, in order to exclude systematic differences due to variations in these parameters. We found that, depending on the value of angular velocity and the direction of rotation of the external environment with respect to the core, the resulting disks can be characterized by vastly different physical properties.
Our most interesting finding is that infall of material from the external environment counter-rotating with respect to the core may lead to forming inner and outer disks that rotate in opposite directions. The transitional region between the disks manifests itself as a deep gap in the gas density, which migrates inward owing to accretion of the inner disk onto the protostar. After about several tens of kyr, the gap turns into a central hole, which fills in after another few tens of kyr. The formation of a transient gap/hole through the infall from counter-rotating external environment presents an interesting alternative to other mechanisms of gap/hole formation, such as disk photoevaporation (Clarke et al. 2001; Owen et al. 2010) or gravitational clearing owing to a massive planet (e.g., Kley et al. 2001). Our main results can be summarized as follows.
-
Prestellar cores submerged into an external environment corotating at an angular velocity similar in magnitude to that of the core tend to form extended and strongly unstable disks, which fragment into several objects connected by dense filaments and in the long run may form systems with substellar/very-low-mass companions. The mass accretion rate onto the primary shows a highly variable character with episodic bursts caused by the infall of some of the fragments onto the star.
-
Prestellar cores embedded into a slowly corotating external environment (with ten times lower angular velocity than that of the core) are likely to form compact (Rd ≤ 200 AU) disks, which are stable against gravitational fragmentation thanks to their small size. These disks can drive order-of-magnitude higher mass accretion rates onto the star than those formed from isolated cores.
-
Prestellar cores submerged into a slowly counter-rotating external environment are expected to form compact (Rd ≤ 200 AU) and short-lived (≲a few × 105 yr) disks because of strong negative torques exerted by the infalling external material.
-
Disks formed from prestellar cores embedded in an external environment counter-rotating with respect to the core at a similar angular velocity are likely to change their initial direction of rotation. In the process of this transformation, the inner and outer disks counter-rotate with respect to each other and are separated by a transient gap in the gas density. In the long run, the inner disk accretes onto the star, and a transient stellar system with planetary/substellar components counter-rotating with respect to that of the star may emerge due to gravitational fragmentation of the outer, strongly unstable disk.
When the gas temperature exceeds 2000 K, γ is set to 1.1, but a limited numerical resolution does not allow us to follow the second collapse of hot fragments.
This definition of the midplane temperature is accurate within a factor of unity (Zhu et al. 2012).
These numbers should be taken with caution because our disk-tracking algorithm may be inaccurate on systems with violently fragmenting disks.
We have not calculated the angular momentum flux through the sink cell. This study will be presented in a follow-up paper.
Acknowledgments
We thank the referee for constructive comments that helped to improve the manuscript. This project was partly supported by the Russian Ministry of Education and Science Grant (state assignment) 3.961.2014/K. M.G. acknowledges support by the Austrian FWF through the NFN project grant S116 Pathways to Habitability: from Disks to Active Stars, Planets and Life, and the related subproject S116 604-N16 Radiation & Wind Evolution from T Tauri Phase to ZAMS and Beyond. The simulations were performed on the Shared Hierarchical Academic Research Computing Network (SHARCNET), on the Atlantic Computational Excellence Network (ACEnet), and on the Vienna Scientific Cluster (VSC-2). This publication is supported by the Austrian Science Fund (FWF).
References
- Andrews, S. M., Wilner, D. J., Huges, A. M., Qi, C., & Dullemond, C. P. 2009, ApJ, 700, 1502 [NASA ADS] [CrossRef] [Google Scholar]
- Baraffe, I., & Chabrier, G. 2010, A&A, 521, A44 [NASA ADS] [CrossRef] [EDP Sciences] [Google Scholar]
- Baraffe, I., Chabrier, G., Allard, F., & Hauschildt, P. H. 2002, A&A, 382, 563 [NASA ADS] [CrossRef] [EDP Sciences] [Google Scholar]
- Baraffe, I., Vorobyov, E. I., & Chabrier, G. 2012, ApJ, 756, 118 [NASA ADS] [CrossRef] [Google Scholar]
- Basu, S., & Mouschovias, T. Ch. 1994, ApJ, 432, 720 [NASA ADS] [CrossRef] [Google Scholar]
- Basu, S., & Vorobyov, E. I. 2012, ApJ, 750, 30 [NASA ADS] [CrossRef] [Google Scholar]
- Bate, M., Lodato, G., Pringle, J. E., 2014, MNRAS, 401, 1505 [Google Scholar]
- Beccari, G., Spezzi, L., De Marchi, G., et al. 2010, ApJ, 720, 1108 [NASA ADS] [CrossRef] [Google Scholar]
- Bell, K. R., Lin, D. N. C., 1994, ApJ, 427, 987 [NASA ADS] [CrossRef] [Google Scholar]
- Bisikalo, D. V., Dodin, A. V., Kaigorodov, P. V., et al. 2012, Astron. Rep., 56, 686 [NASA ADS] [CrossRef] [Google Scholar]
- Boley, A. C., Hayfield, T., Mayer, L., & Durisen, R. H. 2010, Icarus, 207, 509 [NASA ADS] [CrossRef] [Google Scholar]
- Brown, J. M., Blake, G. A., Qi, C., Dullemond, C. P., & Wilner, D. J., ApJ, 675, L109 [Google Scholar]
- Cha, S.-H., & Nayakshin, S. 2011, MNRAS, 415, 3319 [NASA ADS] [CrossRef] [Google Scholar]
- Chabrier, G., & Baraffe, I. 2000, ARA&A, 38, 337 [NASA ADS] [CrossRef] [Google Scholar]
- Clarke, C. J., Gendrin, A., & Sotomayor, M., 2001, MNRAS, 328, 485 [NASA ADS] [CrossRef] [Google Scholar]
- Dapp, W. B., & Basu, S. 2009, MNRAS, 395, 1092 [NASA ADS] [CrossRef] [Google Scholar]
- De Marchi, G., Beccari, G., & Panagia, N. 2013a, ApJ, 775, 68 [NASA ADS] [CrossRef] [Google Scholar]
- De Marchi, G., Panagia, N., Guarcello, M. G., & Bonito, R. 2013b, MNRAS, 435, 3058 [NASA ADS] [CrossRef] [Google Scholar]
- Dunham, M. M., & Vorobyov, E. I. 2012, ApJ, 747, 52 [NASA ADS] [CrossRef] [Google Scholar]
- Dunham, M. M., Vorobyov, E. I., Arce, H. G. 2014a, MNRAS, 444, 887 [NASA ADS] [CrossRef] [Google Scholar]
- Dunham, M. M., Stutz, A. M., Allen, L. E., et al. 2014b, in Protostars & Planets VI (University og Arizona Press), accepted [arXiv:1401.1809] [Google Scholar]
- Eisner, J. A. 2012, ApJ, 755, 23 [NASA ADS] [CrossRef] [Google Scholar]
- Evans, N. J., II, Dunham, M. M., Jorgensen, J. K., et al. 2009, ApJS, 181, 321 [NASA ADS] [CrossRef] [Google Scholar]
- Fielding, D. B., McKee, C. F., Socratis, A., Cunningham, A. J., & Klein, R. I. 2014, MNRAS, submitted [arXiv:1409.5148] [Google Scholar]
- Gammie, C. F. 2001, ApJ, 553, 174 [NASA ADS] [CrossRef] [Google Scholar]
- Hernandez, J., Hartmann, L., Megeath, T., et al. 2007, ApJ, 662, 1067 [NASA ADS] [CrossRef] [Google Scholar]
- Hacar, A., & Tafalla, M. 2011, A&A, 533, A34 [NASA ADS] [CrossRef] [EDP Sciences] [Google Scholar]
- Hacar, A., Tafalla, M., Kauffmann, J., & Kovacs, A. 2013, A&A, 554, A55 [NASA ADS] [CrossRef] [EDP Sciences] [Google Scholar]
- Johnson, B. M., & Gammie, C. F. 2003, ApJ, 597, 131 [NASA ADS] [CrossRef] [Google Scholar]
- Jorgensen, J. K., van Dishoeck, E. F., Visser, R., et al. 2009, A&A, 507, 861 [NASA ADS] [CrossRef] [EDP Sciences] [Google Scholar]
- Kley, W., D’Angelo, G., & Henning, T. 2001, ApJ, 547, 457 [NASA ADS] [CrossRef] [Google Scholar]
- Kratter, K. M., Matzner, C. D., Krumholz, M. R., & Klein, R. I. 2010, ApJ, 708, 1585 [NASA ADS] [CrossRef] [Google Scholar]
- Masunaga, H., & Inutsuka, S.-I. 2000, ApJ, 531, 350 [NASA ADS] [CrossRef] [Google Scholar]
- Machida, M. N., Inutsuka, S., & Matsumoto, T. 2011a, ApJ, 729, 42 [NASA ADS] [CrossRef] [Google Scholar]
- Machida, M. N., Inutsuka, S., & Matsumoto, T. 2011b, PASJ, 63, 555 [NASA ADS] [CrossRef] [Google Scholar]
- Maury, A. J., Andre, Ph., Hennebelle, P., et al. 2010, A&A, 512, A40 [NASA ADS] [CrossRef] [EDP Sciences] [Google Scholar]
- McKee, C. F., & Offner, S. S. R. 2010, ApJ, 716, 167 [NASA ADS] [CrossRef] [Google Scholar]
- Meru, F., & Bate, M. R. 2012, MNRAS, 427, 2022 [NASA ADS] [CrossRef] [Google Scholar]
- Murillo, N. M., Lai, S.-P., Bruderer, S., Harsono, D., & van Dishoeck, E. F. 2013, A&A, 560, A103 [NASA ADS] [CrossRef] [EDP Sciences] [Google Scholar]
- Owen, J. E., Ercolano, B., Clarke, C. J., & Alexander, R. D. 2010, MNRAS, 401, 1415 [NASA ADS] [CrossRef] [Google Scholar]
- Padoan, P., Juvela, M., Goodman, A. A., & Nordlund, A. 2001, ApJ, 553, 227 [NASA ADS] [CrossRef] [Google Scholar]
- Padoan, P., Haugbolle, T., & Nordlung, A. 2014, ApJ, 797, 32 [NASA ADS] [CrossRef] [Google Scholar]
- Rice, W. K. M., Armitage, P. J., Bate, M. R., & Bonnell, I. A. 2003, MNRAS, 339, 1025 [NASA ADS] [CrossRef] [Google Scholar]
- Rice, W. K. M., Mayo, J. N., & Armitage, P. J. 2010, MNRAS, 402, 1740 [NASA ADS] [CrossRef] [Google Scholar]
- Scicluna, P., Rosotti, G., Dale, J. E., & Testi, L. 2014, A&A, 566, A3 [Google Scholar]
- Seifried, D., Banerjee, R., Pudritz, R. E., & Klessen, R. S. 2012, MNRAS, 423, L40 [Google Scholar]
- Shu, F. H., Adams, F. C., & Lizano, S. 1987, ARA&A, 25, 23 [Google Scholar]
- Stamatellos, D., & Whitworth, A. P. 2008, A&A 480, 879 [Google Scholar]
- Stamatellos, D., Maury, A., Whitworth, A., & André, P. 2011, MNRAS, 413, 1787 [NASA ADS] [CrossRef] [Google Scholar]
- Tobin, J. J., Hartmann, L., & Chiang, H.-F., et al. 2012, Nature, 492, 83 [NASA ADS] [CrossRef] [PubMed] [Google Scholar]
- Vicente, S. M., & Alves, J. 2005, A&A, 441, 195 [NASA ADS] [CrossRef] [EDP Sciences] [Google Scholar]
- Vorobyov, E. I. 2010, ApJ, 713, 1059 [NASA ADS] [CrossRef] [Google Scholar]
- Vorobyov, E. I. 2011, ApJ, 729, 146 [NASA ADS] [CrossRef] [Google Scholar]
- Vorobyov, E. I. 2013, A&A, 552, A129 [NASA ADS] [CrossRef] [EDP Sciences] [Google Scholar]
- Vorobyov, E. I., & Basu, S. 2006, ApJ, 650, 956 [NASA ADS] [CrossRef] [Google Scholar]
- Vorobyov, E. I., & Basu, S. 2010, ApJ, 719, 1896 [NASA ADS] [CrossRef] [Google Scholar]
- Vorobyov, E. I., Zakhozhay, O., Dunham, M. M. 2013a, MNRAS, 433, 3256 [NASA ADS] [CrossRef] [Google Scholar]
- Vorobyov, E. I., Baraffe, I., Harries, T., Chabrier, G. 2013b, A&A, 557, A35 [NASA ADS] [CrossRef] [EDP Sciences] [Google Scholar]
- Woitas, J., Bacciotti, F., Ray, T. P., et al. 2005, A&A, 432, 149 [NASA ADS] [CrossRef] [EDP Sciences] [Google Scholar]
- Zhu, Z., Hartmann, L., Nelson, R. P., & Gammie, C. F. 2012, ApJ, 746, 110 [NASA ADS] [CrossRef] [Google Scholar]
All Tables
All Figures
|
Fig. 1 Initial distribution of the gas surface density (left panels) and angular velocity (right panels) in five considered models. The horizontal dotted line marks the zero angular velocity. |
| In the text | |
|
Fig. 2 Gas surface density maps in Model 1 in the inner 1000 × 1000 AU box obtained at several evolution times (as marked in each panel) after the formation of the central protostar. The scale bar is in log g cm-2. |
| In the text | |
|
Fig. 3 Gas surface density maps in Model 2 in the inner 1000 × 1000 AU box (top row) and 2000 × 2000 AU box (middle and bottom rows) obtained at several evolution times (as marked in each panel) after the formation of the central protostar. The scale bar is in log g cm-2. |
| In the text | |
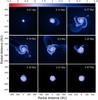 |
Fig. 4 Similar to Fig. 2 but for Model 3. |
| In the text | |
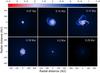 |
Fig. 5 Similar to Fig. 2 but for Model 4. |
| In the text | |
|
Fig. 6 Gas surface density maps in Model 5 in the inner 1000 × 1000 AU box (top row) and 2000 × 2000 AU box (middle and bottom rows) obtained at several evolution times (as marked in each panel) after the formation of the central protostar. The scale bar is in log g cm-2. |
| In the text | |
|
Fig. 7 Development of a cavity in the disk. Shown with yellow arrows is the gas velocity field superimposed on the gas surface density in the inner 600 × 600 AU box in Model 5. The bar is in log g cm-2. |
| In the text | |
|
Fig. 8 Time series of azimuthally averaged gas surface density profiles ( |
| In the text | |
|
Fig. 9 Centrifugal radius Rcf as a function of radial distance in Models 1–5. |
| In the text | |
|
Fig. 10 Left column: masses of the disk (solid lines), star (dashed lines), and envelope (dash-dotted lines) as a function of time elapsed since the formation of the protostar in Models 1–5 (from top to bottom rows). Right column: the corresponding disk radii. |
| In the text | |
|
Fig. 11 Mass accretion rates through the sink cell at r = 5 AU (black solid lines) and mass infall rates at r = 2000 AU (red dashed lines) in Models 1–5 (from top to bottom). |
| In the text | |
Current usage metrics show cumulative count of Article Views (full-text article views including HTML views, PDF and ePub downloads, according to the available data) and Abstracts Views on Vision4Press platform.
Data correspond to usage on the plateform after 2015. The current usage metrics is available 48-96 hours after online publication and is updated daily on week days.
Initial download of the metrics may take a while.