Free Access
Fig. 5
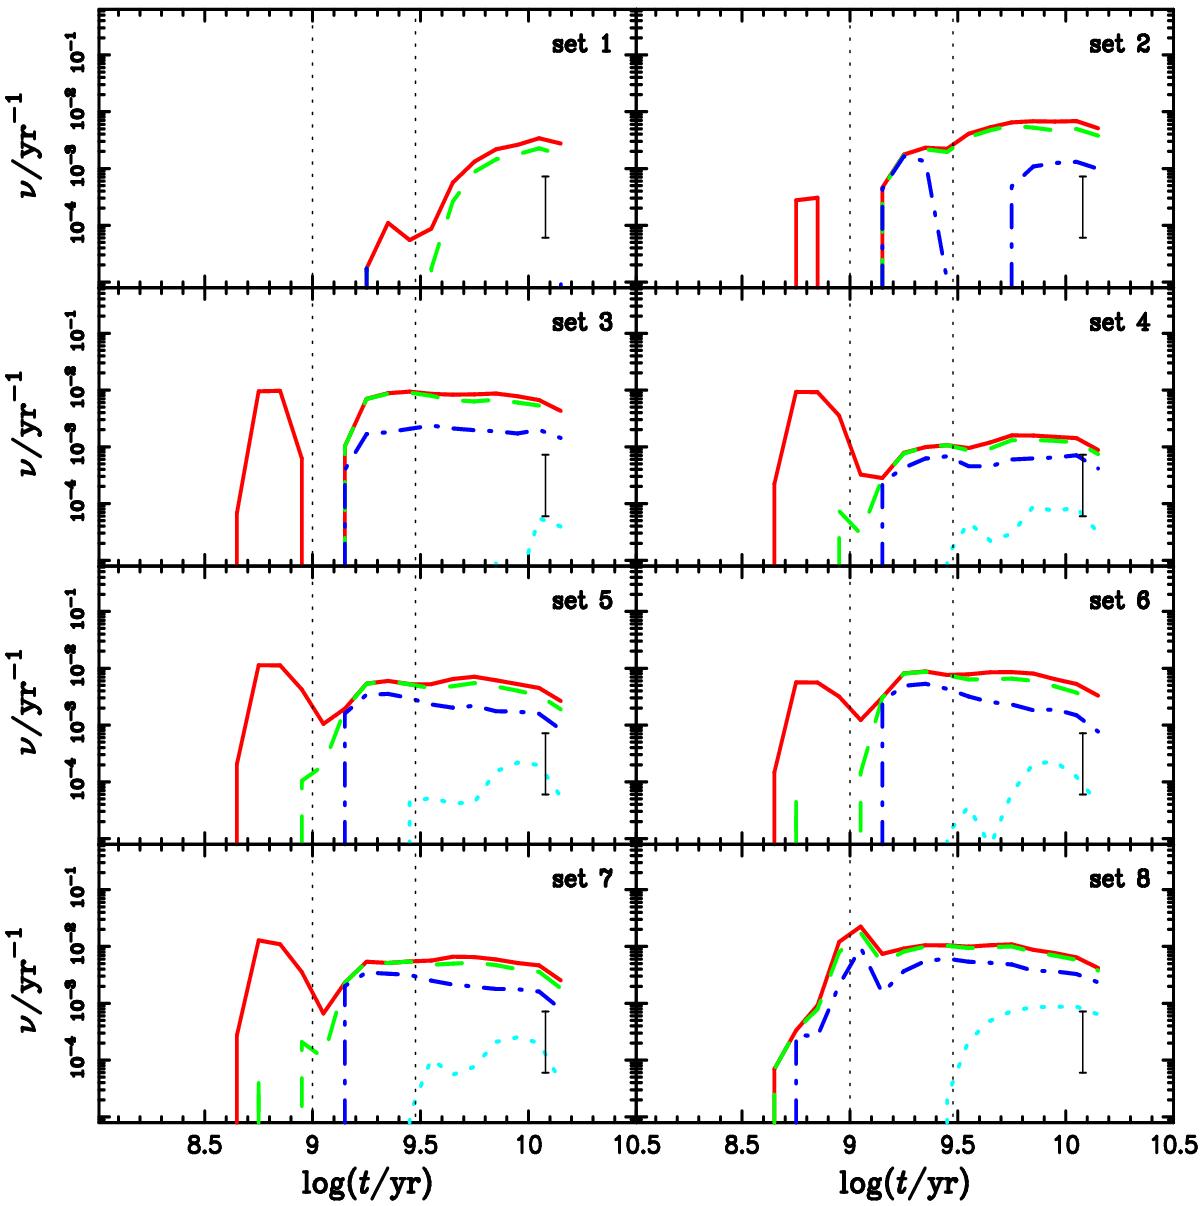
Evolution of the merging rate for systems with MCO ≤ 0.6 M⊙ (0.55 M⊙ for set 8) and MHe ≤ 0.4M⊙ (red solid line), MHe ≤ 0.3M⊙ (green dashed line), MHe ≤ 0.25M⊙ (blue dot-dashed line), and MHe ≤ 0.2M⊙ (light-blue dotted line). The two vertical dotted lines indicate the delay times of 1 Gyr and 3 Gyr.
Current usage metrics show cumulative count of Article Views (full-text article views including HTML views, PDF and ePub downloads, according to the available data) and Abstracts Views on Vision4Press platform.
Data correspond to usage on the plateform after 2015. The current usage metrics is available 48-96 hours after online publication and is updated daily on week days.
Initial download of the metrics may take a while.