Fig. 3
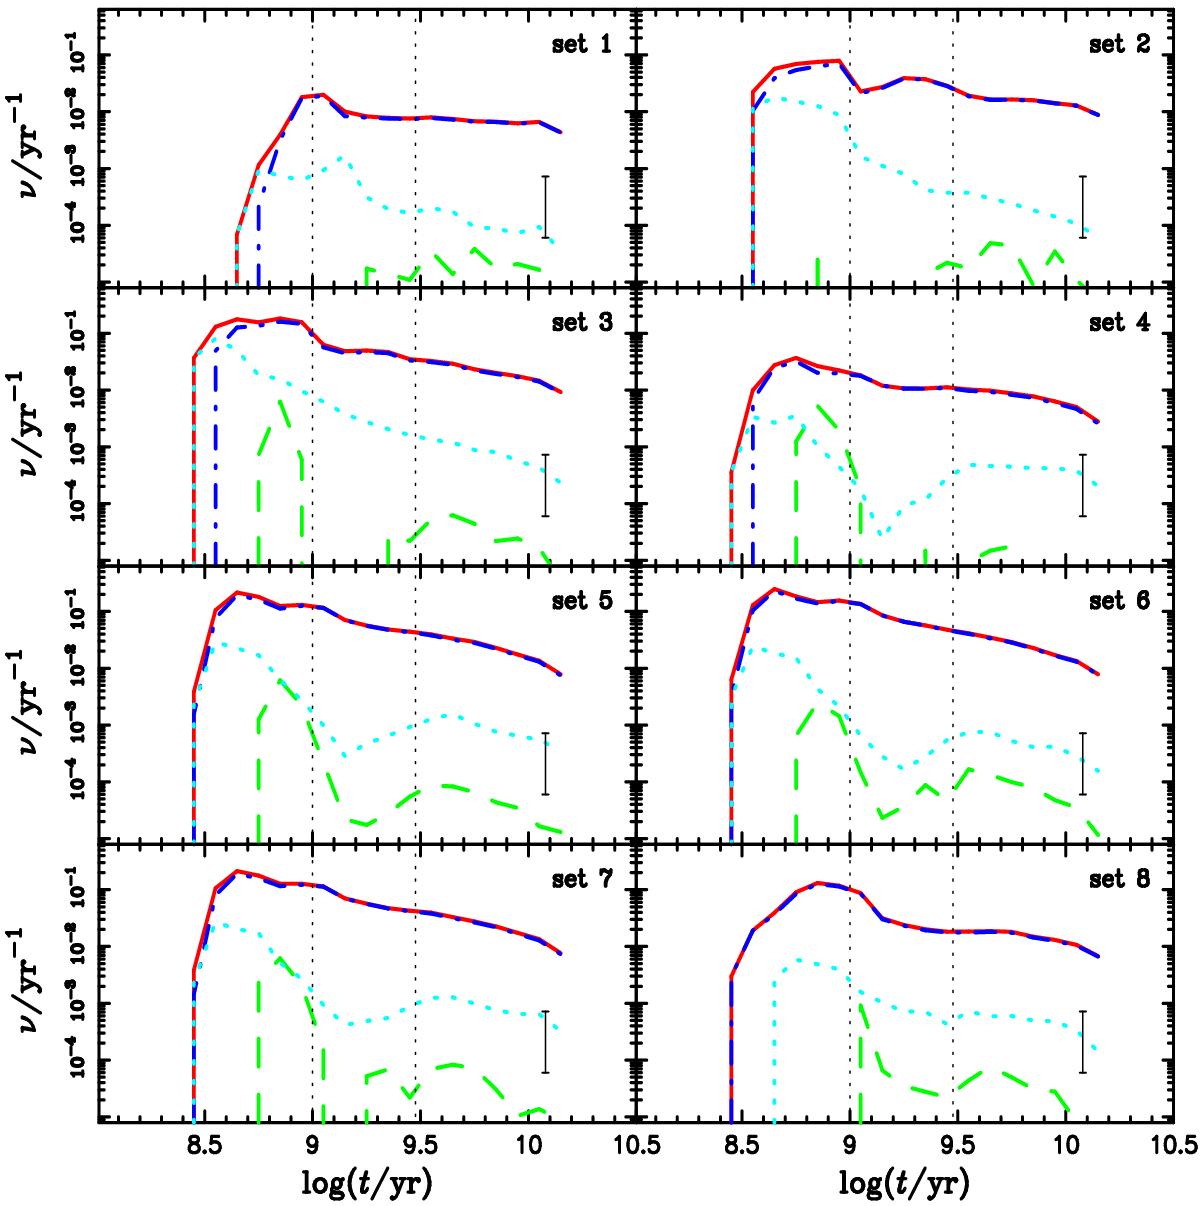
Evolution of the birth rate of potential candidates of CRT progenitors. The red solid line is for all the potential systems, while the green dashed and light-blue dotted lines are for those with always unstable and stable mass transfer, respectively. The blue dot-dashed line represents the systems whose mass transfer is neither always stable nor always unstable (see also Fig. 1). The vertical bar indicates the range of the birth rate of CRTs, normalized to the birth rate of SNe Ia in S0/E galaxies (Mannucci et al. 2005). The two vertical dotted lines mark the positions of delay times of 1 Gyr and 3 Gyr.
Current usage metrics show cumulative count of Article Views (full-text article views including HTML views, PDF and ePub downloads, according to the available data) and Abstracts Views on Vision4Press platform.
Data correspond to usage on the plateform after 2015. The current usage metrics is available 48-96 hours after online publication and is updated daily on week days.
Initial download of the metrics may take a while.