Fig. 8
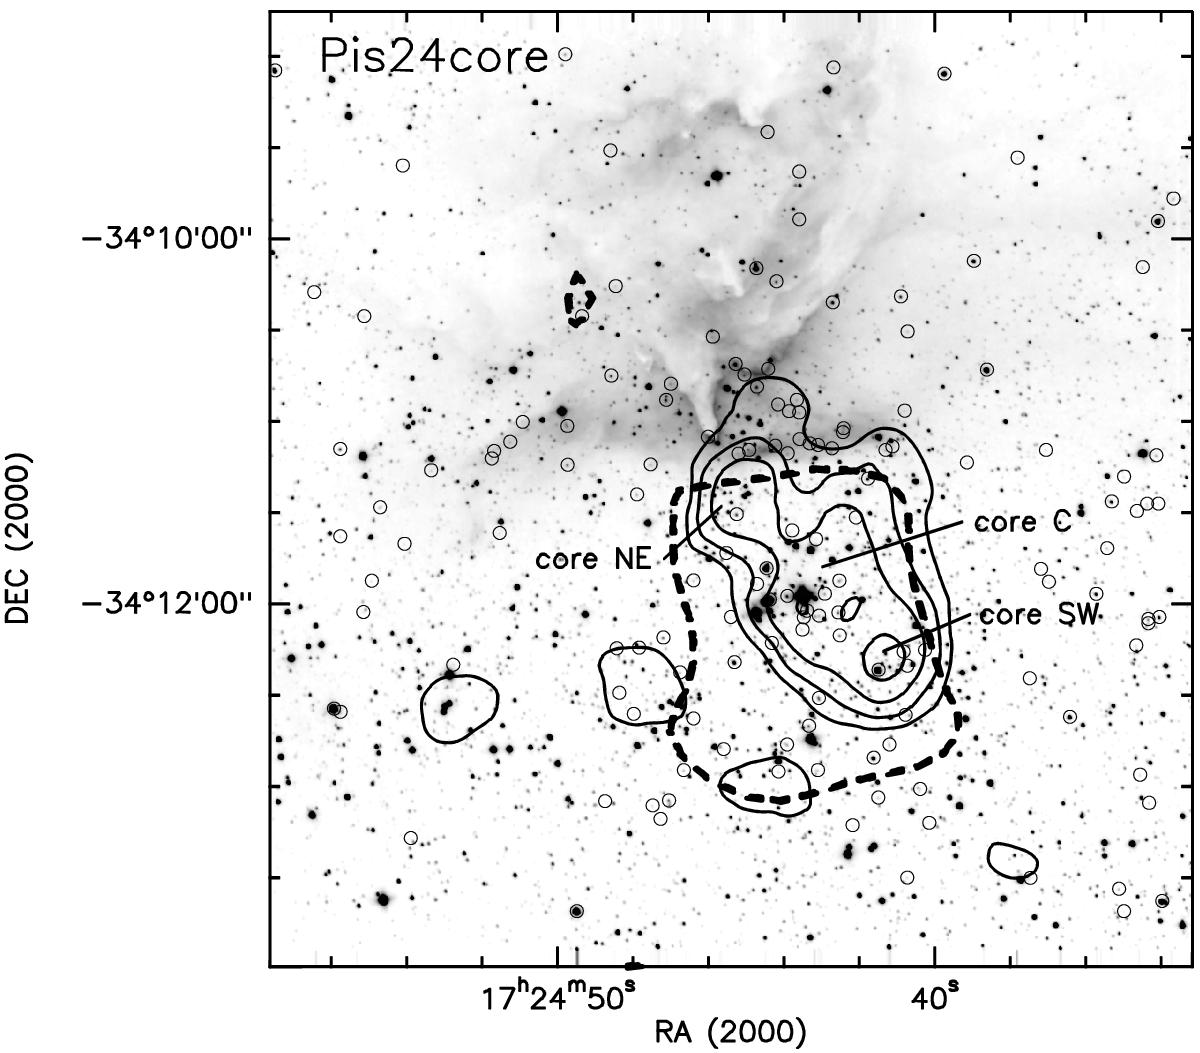
Contour map of the surface density of NIR sources from the SofI data, overlaid with the Ks image of Pismis 24 and G353.2+0.9. Contours range from 240 stars arcmin-2 (the average for field stars plus 2σ, using the values found in the southern field) in steps of 30 stars arcmin-2 (~1σ). Also overlaid: (dashed contour) the surface density of IRAC sources (level 36 stars arcmin-2 of Fig. 5) delineating Pis24 core; (open circles) the location of sources with a NIR excess (see the text for the selection criteria). All data used in figure have Ks< 16 and photometric errors <0.3 mag both in Ks (surface density) and in all JHKs bands (NIR excess).
Current usage metrics show cumulative count of Article Views (full-text article views including HTML views, PDF and ePub downloads, according to the available data) and Abstracts Views on Vision4Press platform.
Data correspond to usage on the plateform after 2015. The current usage metrics is available 48-96 hours after online publication and is updated daily on week days.
Initial download of the metrics may take a while.