Fig. 5
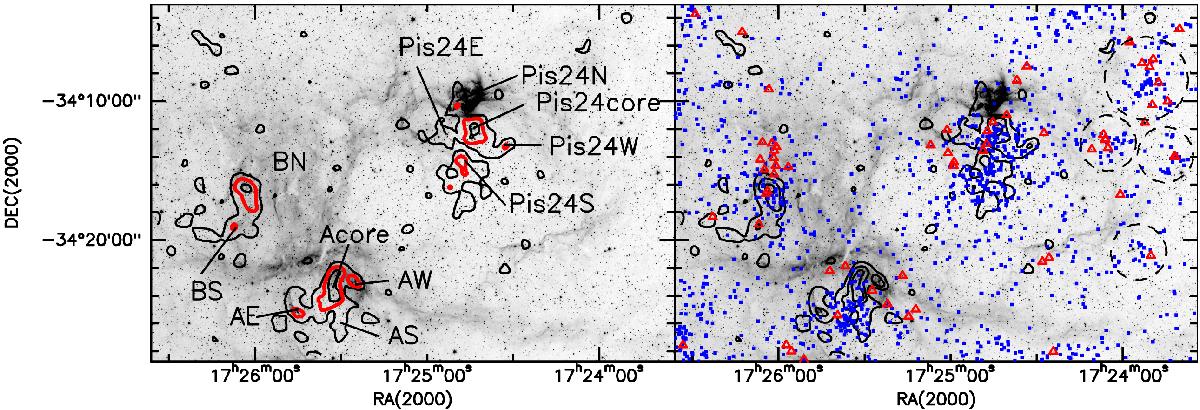
Left. Contour map of the surface density of IRAC sources, computed as explained in the text. Only sources detected in at least the first two Spitzer/IRAC bands, with photometric errors <0.3 mag, and up to [3.6] = 12.25 are considered. The contours are: 25 stars/arcmin2, 36 stars/arcmin2 (red line), 47 stars/arcmin2, ranging in steps of 3σ (11 stars/arcmin2) from the estimated average surface density (14 stars/arcmin2) of field stars plus 3σ, overlaid on the image at 3.6 μm (grey-scale). Also labelled, the tentatively identified subclusters (A is also known as AH03J1725–34.4). Right. Same as left, but with the positions of identified Class II sources (full blue squares) and Class I sources (open red triangles) superimposed. Other YSO concentrations are enclosed in dashed-line circles. A colour version of this figure is available in the on-line edition.
Current usage metrics show cumulative count of Article Views (full-text article views including HTML views, PDF and ePub downloads, according to the available data) and Abstracts Views on Vision4Press platform.
Data correspond to usage on the plateform after 2015. The current usage metrics is available 48-96 hours after online publication and is updated daily on week days.
Initial download of the metrics may take a while.