Free Access
Fig. 4
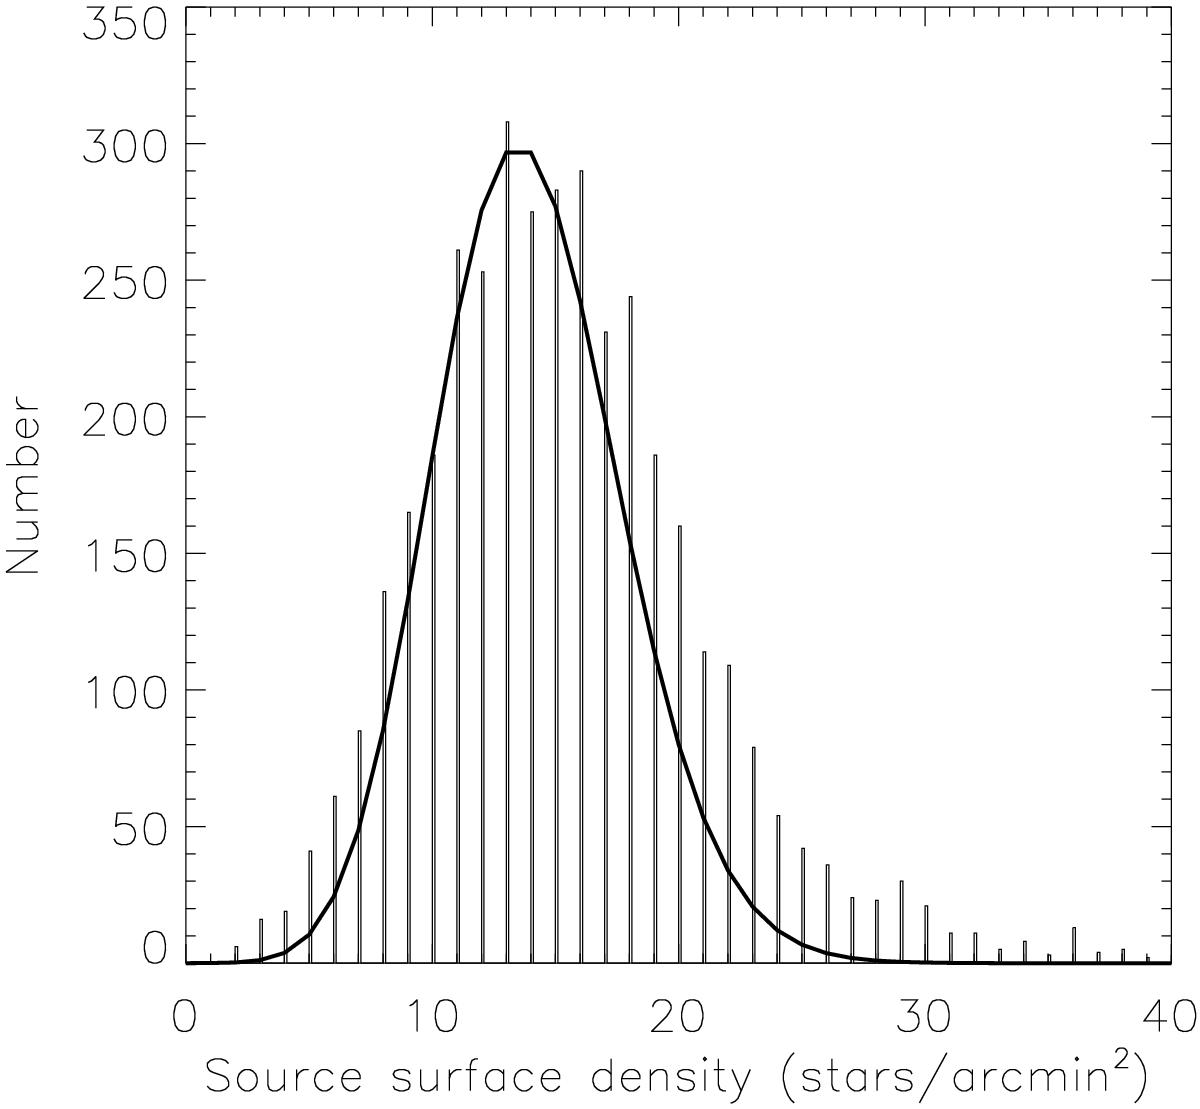
Histogram of the statistics of the surface distribution of IRAC sources detected at least in the two lower-wavelength bands, counted in squares 1′ in size, displaced each other by ![]() in right ascension and/or declination (i.e., a Nyquist sampling interval). Overlaid (full line), a Poisson curve with mean =14 stars/arcmin2.
in right ascension and/or declination (i.e., a Nyquist sampling interval). Overlaid (full line), a Poisson curve with mean =14 stars/arcmin2.
Current usage metrics show cumulative count of Article Views (full-text article views including HTML views, PDF and ePub downloads, according to the available data) and Abstracts Views on Vision4Press platform.
Data correspond to usage on the plateform after 2015. The current usage metrics is available 48-96 hours after online publication and is updated daily on week days.
Initial download of the metrics may take a while.