Fig. F.2
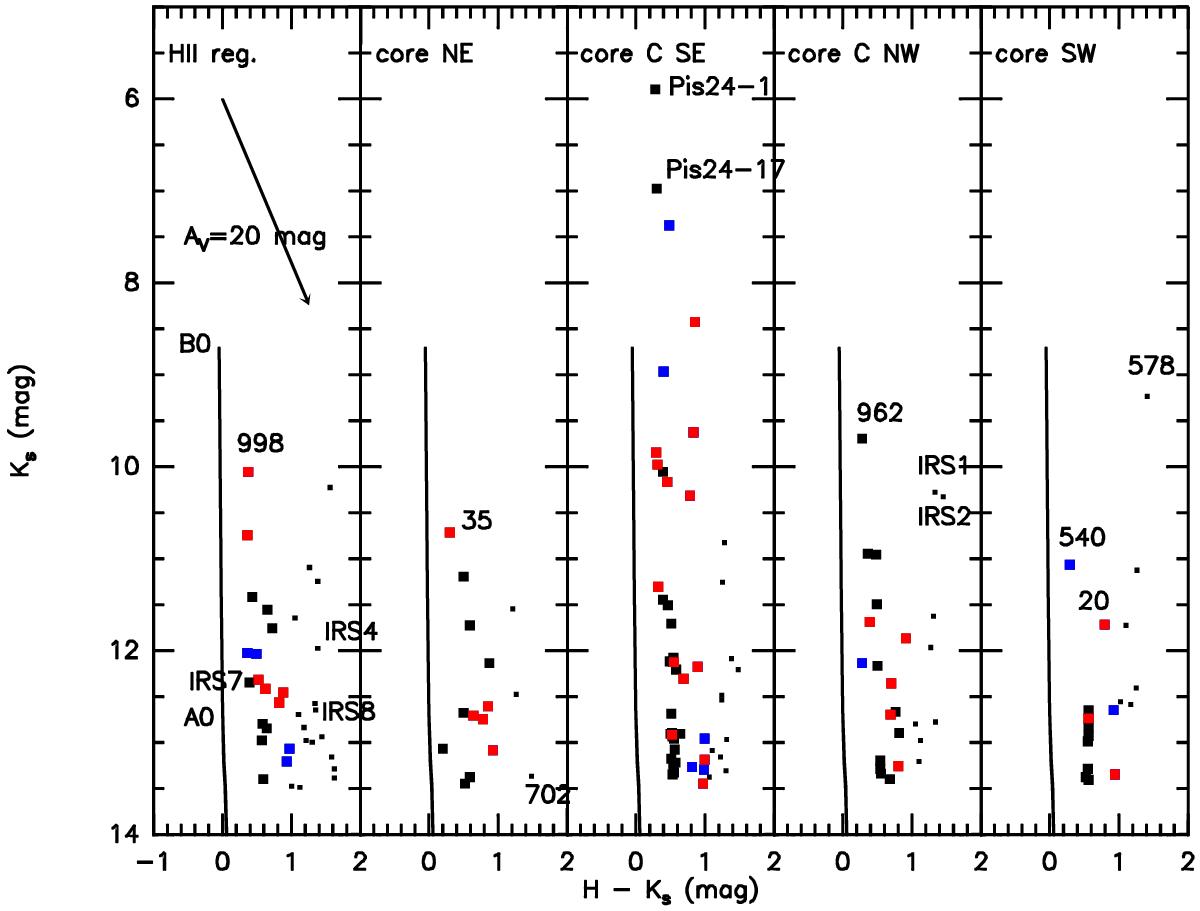
Ks vs. H − Ks for NIR sources towards the five areas (or subclusters) selected in the SofI field of view. Sources with a JHKs colour excess (and H − Ks< 1) are marked by blue squares, sources with a JH(HKs) [4.5] colour excess (and H − Ks< 1) are marked by red squares, other sources are marked by black squares (small squares for H − Ks ≥ 1). The ZAMS is also drawn in each diagram, whereas an arrow in the first box from left marks an extinction AV = 20 mag. The sources discussed in the text are labelled, as well.
Current usage metrics show cumulative count of Article Views (full-text article views including HTML views, PDF and ePub downloads, according to the available data) and Abstracts Views on Vision4Press platform.
Data correspond to usage on the plateform after 2015. The current usage metrics is available 48-96 hours after online publication and is updated daily on week days.
Initial download of the metrics may take a while.