Fig. E.1
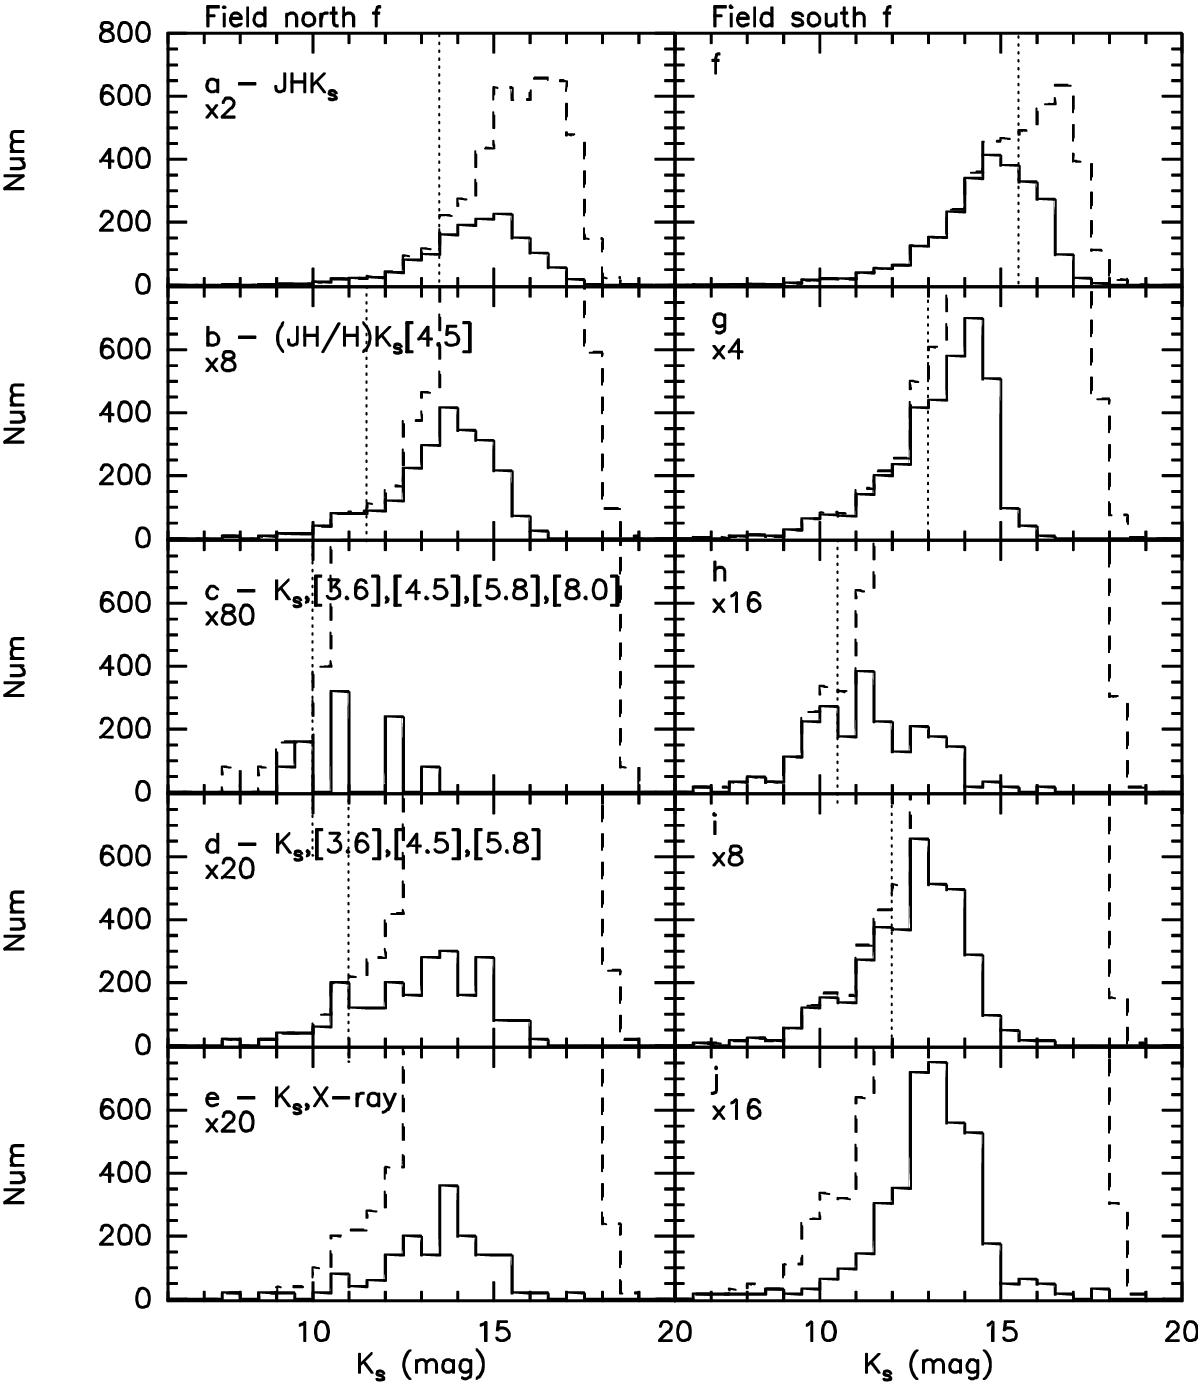
Number of Ks sources per magnitude in bins of 0.5 mag (dashed line) compared with (full line): the number of Ks sources with also good detections both at J and Ha), northern field; f) southern field; the number of Ks sources with also good detections either at both J and H or at least at H, and in the IRAC 4.5 μm band b), northern field; g) southern field; the number of Ks sources with also good detections in all four IRAC bands c), northern field; h) southern field; the number of Ks sources with also good detections in the first three IRAC bands d), northern field; i) southern field; the number of Ks sources that exhibits an X-ray emission e), northern field; j) southern field. We only took into account sources with photometric uncertainty <0.3 mag in all the considered bands. In addition, the samples plotted in panels c), d), h), i), have been rid of sources with colours indicating PAH contamination as explained in Appendix D. On the upper left corner of each box, a xN tag indicates whether the histograms plotted have been multiplied by a constant N to expand the scale. The vertical dotted lines mark the Ks values at which ~80% of the Ks sources are still retrieved when requiring simultaneous valid detections in other bands.
Current usage metrics show cumulative count of Article Views (full-text article views including HTML views, PDF and ePub downloads, according to the available data) and Abstracts Views on Vision4Press platform.
Data correspond to usage on the plateform after 2015. The current usage metrics is available 48-96 hours after online publication and is updated daily on week days.
Initial download of the metrics may take a while.