Fig. D.4
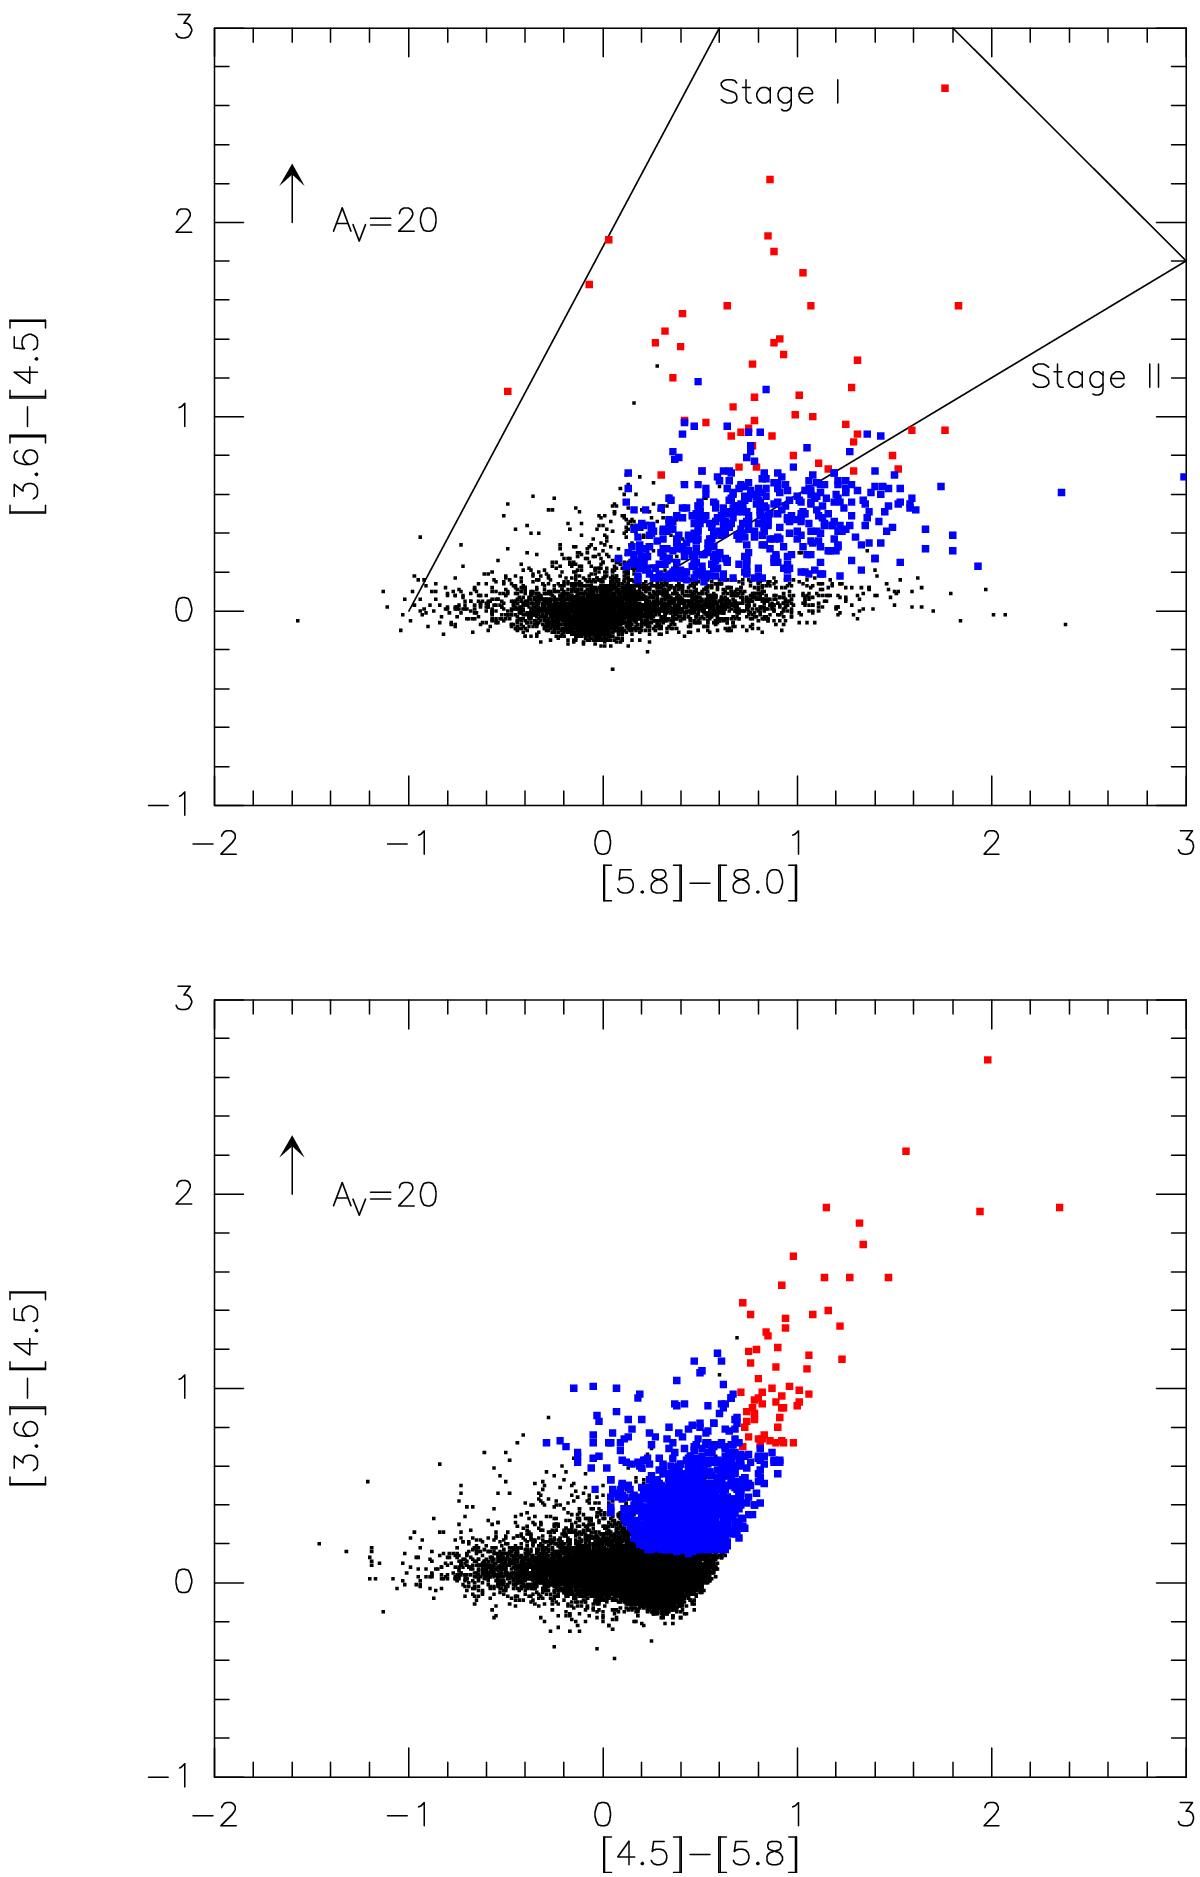
IRAC colour–colour diagrams. Top panel, [3.6] – [4.5] vs. [5.8] – [8.0] for sources detected in all four bands and with photometric errors <0.3 mag. Bottom panel, [3.6] – [4.5] vs. [4.5] – [5.8] for the same sources as above, plus those only detected in the three shorter wavelength bands (with photometric errors <0.3 mag). The two samples have been cleaned of contaminants as explained in the text. Following the prescriptions of Gutermuth et al. (2009) for their identification, Class I sources are in red and Class II sources in blue. Stars are marked as black dots. A reddening corresponding to AV = 20 mag (according to Indebetouw et al. 2005) is marked by an arrow. In the top panel, the regions occupied by Stage I and Stage II sources (Robitaille et al. 2006) are also outlined.
Current usage metrics show cumulative count of Article Views (full-text article views including HTML views, PDF and ePub downloads, according to the available data) and Abstracts Views on Vision4Press platform.
Data correspond to usage on the plateform after 2015. The current usage metrics is available 48-96 hours after online publication and is updated daily on week days.
Initial download of the metrics may take a while.