Fig. C.1
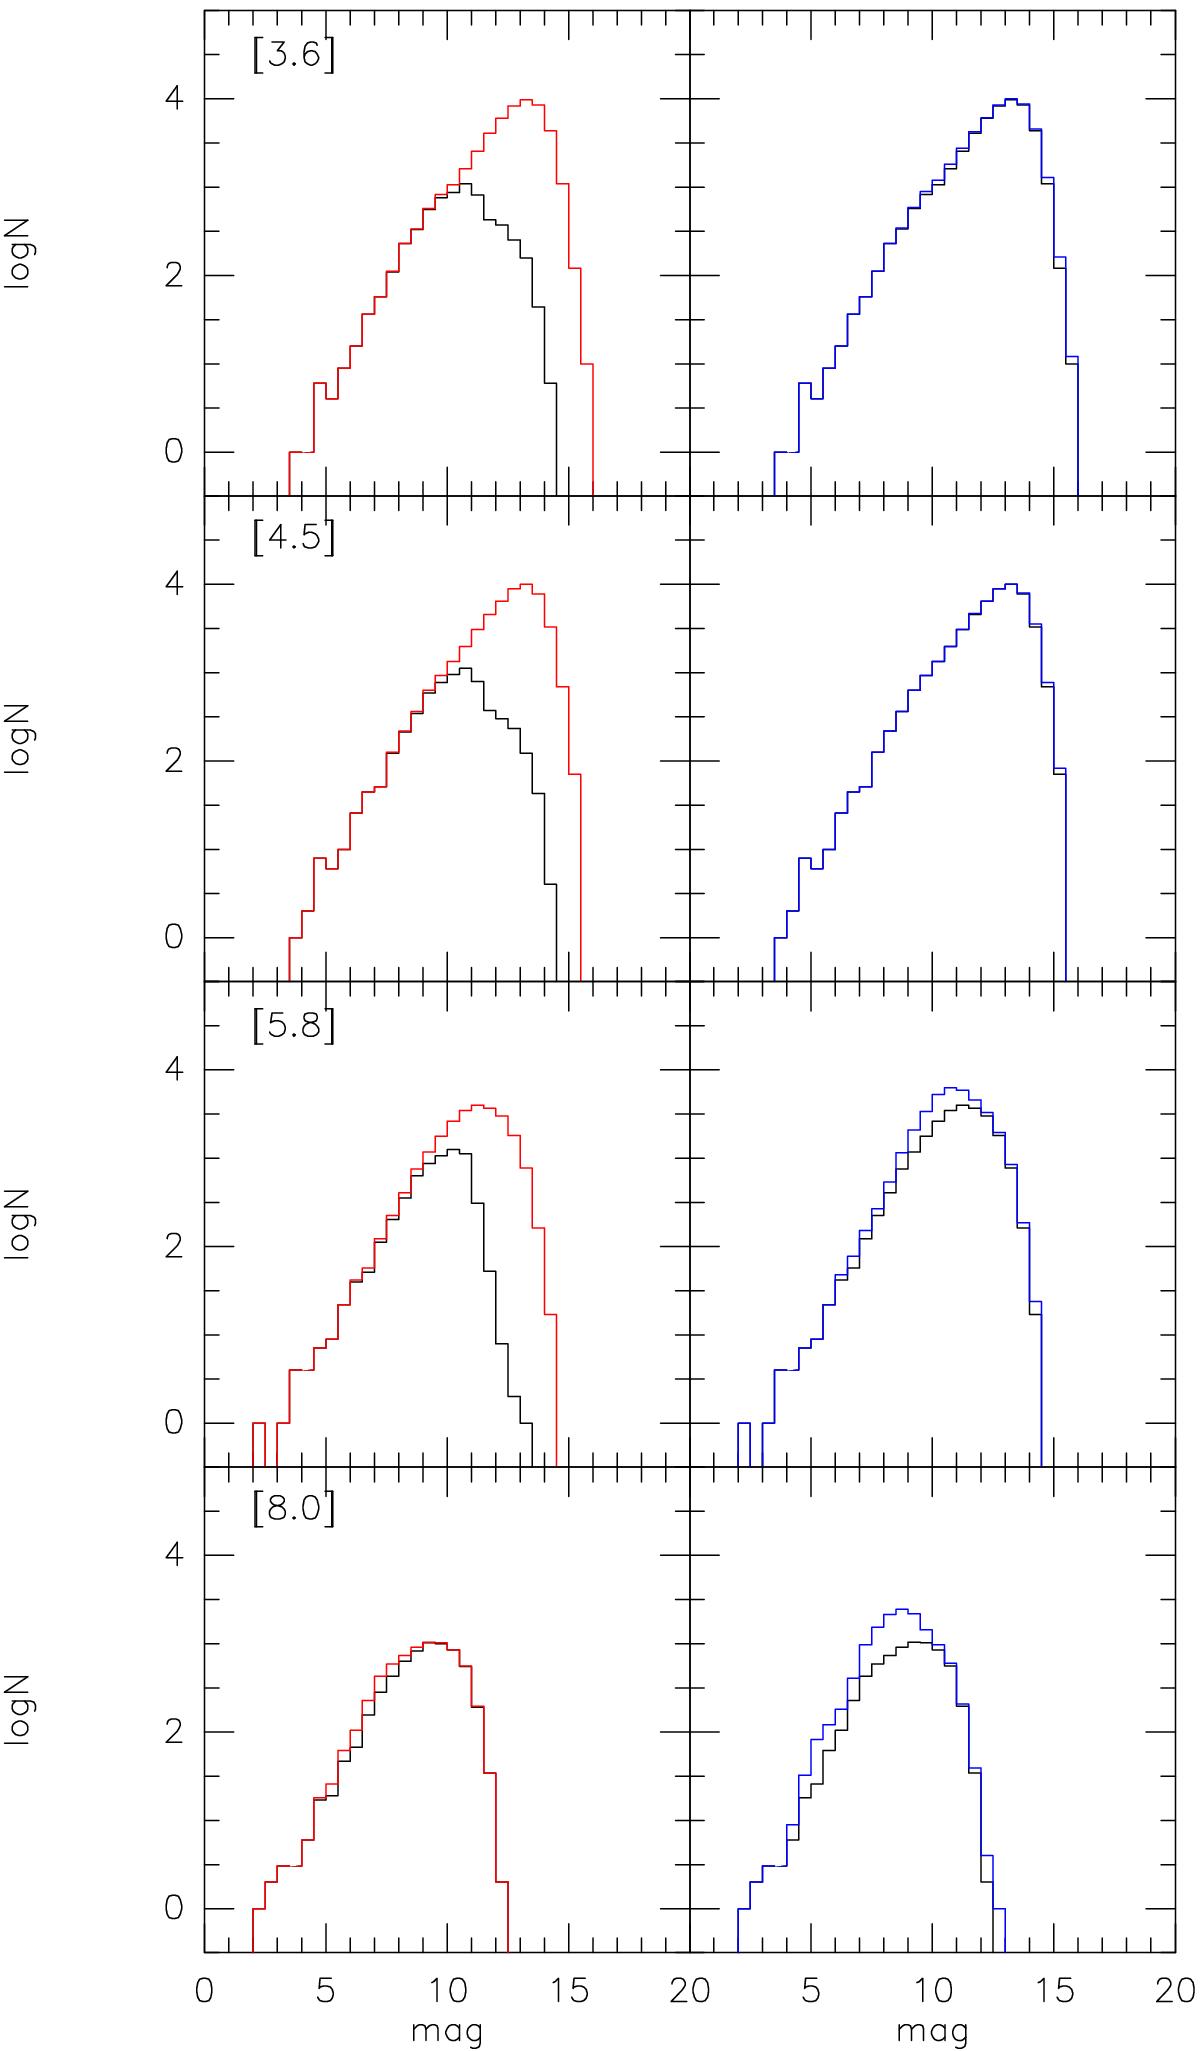
Number of sources retrieved in the I band vs. [I] in bins of 0.5 mag. The boxes in each row refer to the Spitzer/IRAC band I indicated on the upper left corner of the left-hand box. Upper two rows: in the left column, we compare the I-band sources detected in all IRAC bands with photometric errors <0.3 mag (black line), and the sources detected in at least the first two IRAC bands with photometric errors <0.3 mag (red line); in the right column, we compare all sources detected in at least the first two IRAC bands, with photometric errors either <0.3 mag in both bands (black line), or <0.3 mag in at least the considered band I (blue line). Lower two rows: in the left column, we compare the I-band sources detected in all IRAC bands, with photometric errors either <0.3 mag in all bands (black line), or <0.3 mag in at least the considered band I (red line); in the right column, we compare the I-band sources detected in all IRAC bands, with photometric errors <0.3 mag in at least the considered band I (black line), and the sources detected in at least the considered band I with photometric errors <0.3 mag (blue line).
Current usage metrics show cumulative count of Article Views (full-text article views including HTML views, PDF and ePub downloads, according to the available data) and Abstracts Views on Vision4Press platform.
Data correspond to usage on the plateform after 2015. The current usage metrics is available 48-96 hours after online publication and is updated daily on week days.
Initial download of the metrics may take a while.