Fig. B.4
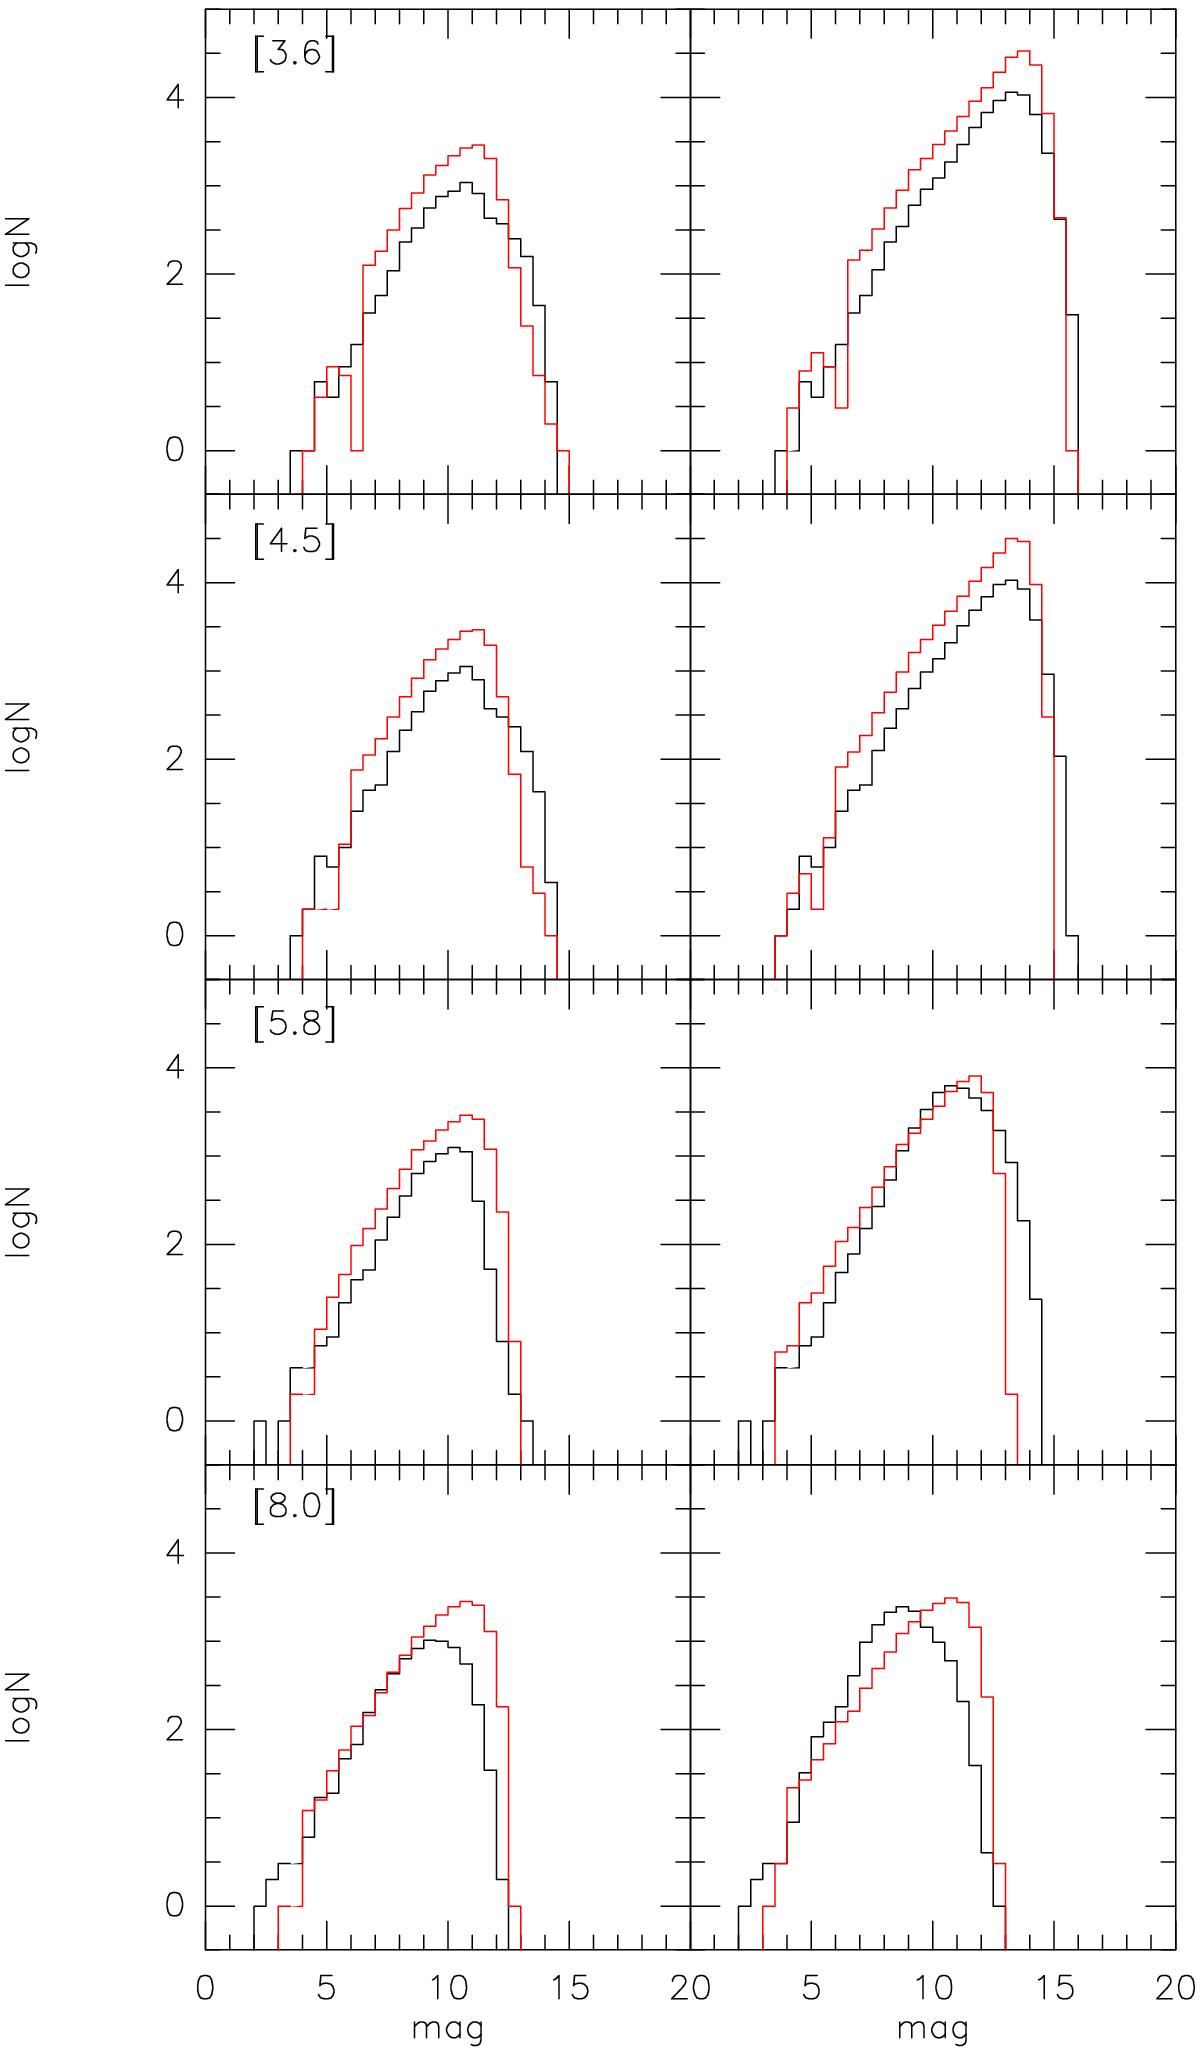
Number of sources per magnitude bins of 0.5 mag, from our database (black line) and the GLIMPSE sample (red line). The boxes in each row refer to the band indicated on the upper left corner. For the diagrams on the left column we used the sources detected in all four IRAC bands with photometric errors <0.3 mag, whereas for those on the right column we used all sources detected in at least the corresponding band (with photometric errors <0.3 mag in that band).
Current usage metrics show cumulative count of Article Views (full-text article views including HTML views, PDF and ePub downloads, according to the available data) and Abstracts Views on Vision4Press platform.
Data correspond to usage on the plateform after 2015. The current usage metrics is available 48-96 hours after online publication and is updated daily on week days.
Initial download of the metrics may take a while.