Fig. B.1
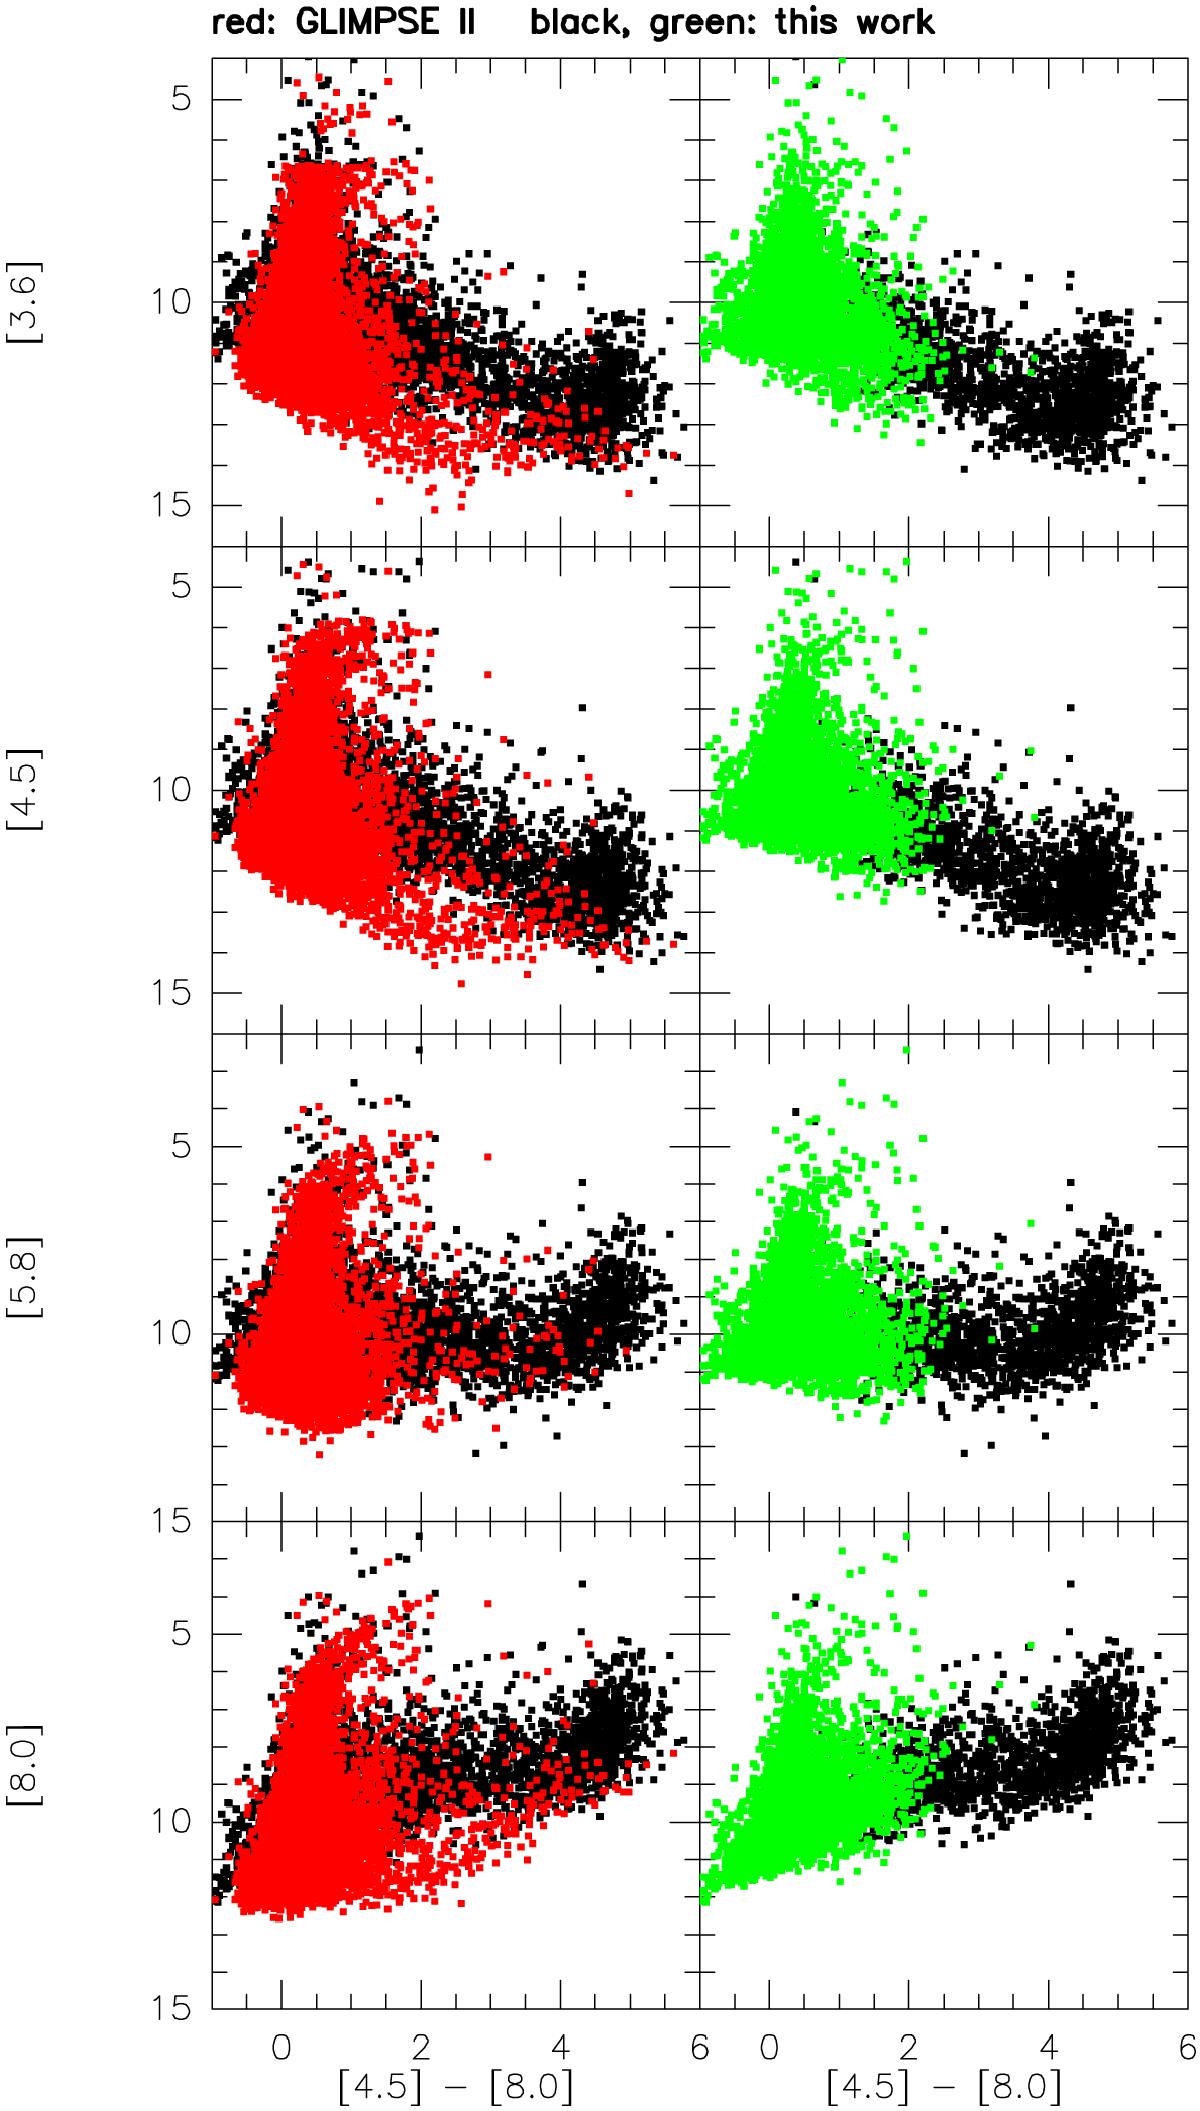
Magnitude–colour diagrams showing the magnitude in the various IRAC bands of the sources from the sample obtained in this work (black dots) as a function of [4.5] – [8.0]. Panels on the same row display, from top to bottom, the measurements for these sources in the 3.6, 4.5, 5.8, and 8.0 μm bands, respectively. In the left column panels, the sources from our sample are overlaid with those from GLIMPSE II (red dots). The green dots in the right column panels are those remaining from our photometry list after removal of sources contaminated by PAH emission. Only objects detected in all four bands with photometric errors <0.3 mag are plotted.
Current usage metrics show cumulative count of Article Views (full-text article views including HTML views, PDF and ePub downloads, according to the available data) and Abstracts Views on Vision4Press platform.
Data correspond to usage on the plateform after 2015. The current usage metrics is available 48-96 hours after online publication and is updated daily on week days.
Initial download of the metrics may take a while.