Fig. 10
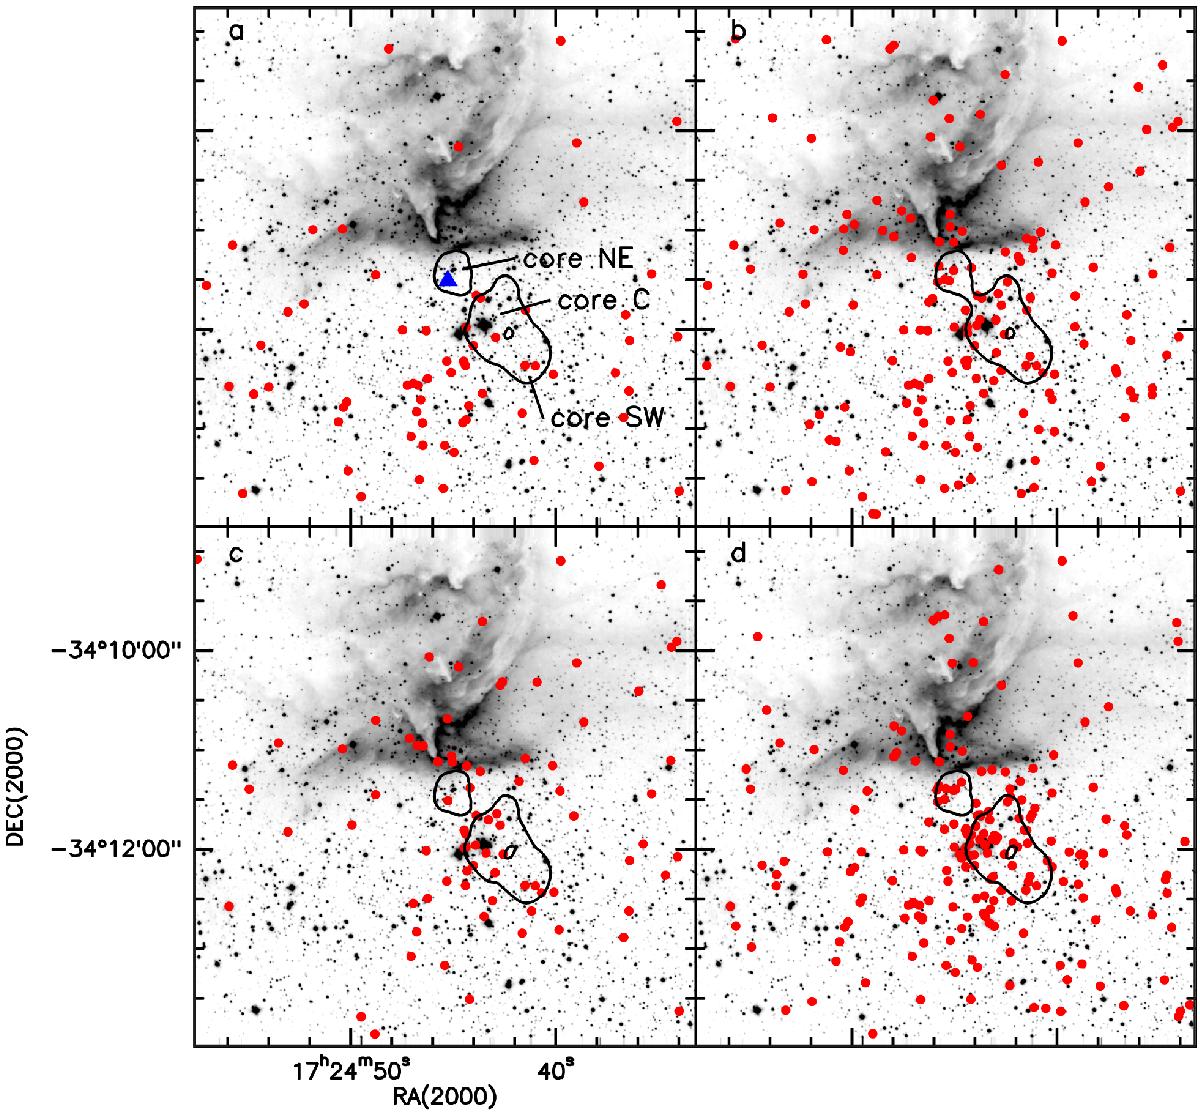
Spatial distribution of the NIR counterparts of the YSOs identified according to four different indicators, as explained in the text, overlaid with the Ks image. Also drawn, a contour of the surface density of Ks sources. Only objects with Ks ≤ 13.5 (unlike Fig. 8, where Ks ≤ 16 has been used) have been selected. a) YSOs identified on the basis of their IRAC colours: red symbols for Class II sources, a large blue triangle marks the only Class I source; b) YSOs identified on the basis of their combined JH(HKs) [4.5] colours; c)JHKs sources exhibiting a colour excess; d) X-ray sources. A colour version of this figure is available in the on-line edition.
Current usage metrics show cumulative count of Article Views (full-text article views including HTML views, PDF and ePub downloads, according to the available data) and Abstracts Views on Vision4Press platform.
Data correspond to usage on the plateform after 2015. The current usage metrics is available 48-96 hours after online publication and is updated daily on week days.
Initial download of the metrics may take a while.